
MariaDB ColumnStore vs. InnoDB vs. MonetDB
In early April, MariaDB‘s CEO Michael Howard announced the development of the MariaDB ColumnStore with the words: “We’re uniting transactional and big data analytics all together under one roof. It’s the same MariaDB interface, security, SQL richness simplifying management. You don’t need to buy specialized hardware. It’s one unified platform.” (Read the full story on CIO.)
MariaDB’s ColumnStore is not entirely new. In 2014, InfiniDB (formally Calpont Corporation) ceased operations but not before releasing their column store technology (called InfiniDB and which was based on MySQL) under an open source license. MariaDB’s ColumnStore is based on InfiniDB and as the release notes say “most of the MariaDB ColumnStore code is unchanged”. We should thus expect no real leaps in comparison to InfiniDB but on the other hand can look forward to hopefully quite a mature and stable first release. A few days ago, the MariaDB team released a first alpha for testing and this is exactly what we did.
Testing a database is quite a challenge, as there are bazillion different use cases that you might want to include in your benchmark. For example, a huge plus of MariaDB’s ColumnStore is that it is fully SQL compliant and, in particular, ACID compliant. One way to test the system would thus be in an OLTP setup with numerous concurrently running small transactions. A second route would be to look at the analytical quality and consider not small transactions, but possibly long running OLAP type queries. In very large setups you might look at the performance of database clusters whereas the majority of projects will probably use only a single database node. Once you have decided on a certain test setup there is, of course, the question of how to measure the performance of the setup as this highly depends on the environment (what machine, how much RAM, disk speed, etc.). For this tentative test we decided to go the easy way: we have set up a single database node on a small virtual machine and used our analytics platform ReportServer to run a few OLAP type queries. We then did a comparative analysis and compared the performance of MariaDB’s ColumnStore against two other databases: the traditional MariaDB/MySQL InnoDB storing engine (to get a baseline) as well as the open source column store MonetDB.
The MonetDB column store has been around for quite a while (since 1993 according to their website) and is primarily developed at the Centrum Wiskunde & Informatica (CWI) in Amsterdam. While MonetDB is coming from academia (and admittedly has some quirks that you need to deal with) it has matured a lot in the previous years. In ReportServer it is supported as of version 3.0.
So in summary the setup is, MariaDB’s new ColumnStore vs. MonetDB (with MySQL InnoDB providing a baseline) on analytical queries within a restricted environment.
The Setup
We performed our tests on a small virtual machine running CentOS. For each test the database system under test was given the full system resources: 8GB of RAM and 50GB of storage. We did not perform any fine tuning of the database configuration and mostly went with the default setup. Naturally, in a real world scenario you would probably use much better equipped machines. However, the intention of this benchmark was to get some first idea of how the database systems compare to one another and for this also a restricted system should be sufficient.
The Data
For our test we used three days worth (to be exact May 1st to May 3rd of this year) of Wikipedia pageview statistics summing up to a total of 450 million data rows. Wikipedia provides data records on an hourly granularity, that is, in total we imported 72 data files. We ran five test scenarios, two hours worth of data (roughly 10 million lines), half a day (75 million rows), one full day (150 million rows), two days (300 million rows) and three days (450 million rows). Each individual data record is rather simple, an example follows:
en Main_Page 242332 4737756101
A data record consists of four fields, the first denoting the project name (e.g., the English Wikipedia), the second the page title, the third the number of requests (within a particular hour), and the last one denoting the size of the content returned. We have appended to each record the date and hour thus giving us records of the form
en Main_Page 242332 4737756101 2016 05 01 00
For each of the five test scenarios we created a database table with the following schema
CREATE TABLE wiki_SCENARIO_NAME(
   category char(20),
   pagename varchar(4048),
   requests int,
   size BIGINT,
   dyear char(4),
   dmonth char(2),
   dday char(2),
   dhour char(2)
) engine=columnstore;
The DDL statement for MonetDB and InnoDB is identical except that there is no engine=columnstore at the end. Since we normalized the input files to only contain ASCII characters, there was also no need to tweak the character encoding.
So in summary, we have in each of the two database systems the following five tables
| Table Name | Number of Records |
|---|---|
| wiki_2_hours |
12,653,400 |
| wiki_half_day |
71,745,608 |
| wiki_one_day |
154,481,494 |
| wiki_two_days |
318,416,889 |
| wiki_three_days |
483,138,223 |
Since the storage space was rather restricted we performed each test consecutively and always only having one filled database table in the system.
The Reports
For our tests we used ReportServer’s Dynamic List, a reporting engine that allows end users to get the data they need, when they need it (and without additional IT involvement). As discussed in “Stars, Spreadsheets and the Dynamic List” our philosophy with the Dynamic List is to outsource as much of the computation for a report onto the underlying database and to have as little as possible within the application itself. After all, database engineers have spent years and years on optimizing data processing. The Dynamic List thus provides us with a perfect “real world” setup for testing automatically generated OLAP type queries.
So what have we looked at? The data itself is quite interesting. To start with we did a simple aggregation looking at the total number of request per hour which gives quite some impressive numbers: about 21 million. Following is a screenshot of the two-hour table:
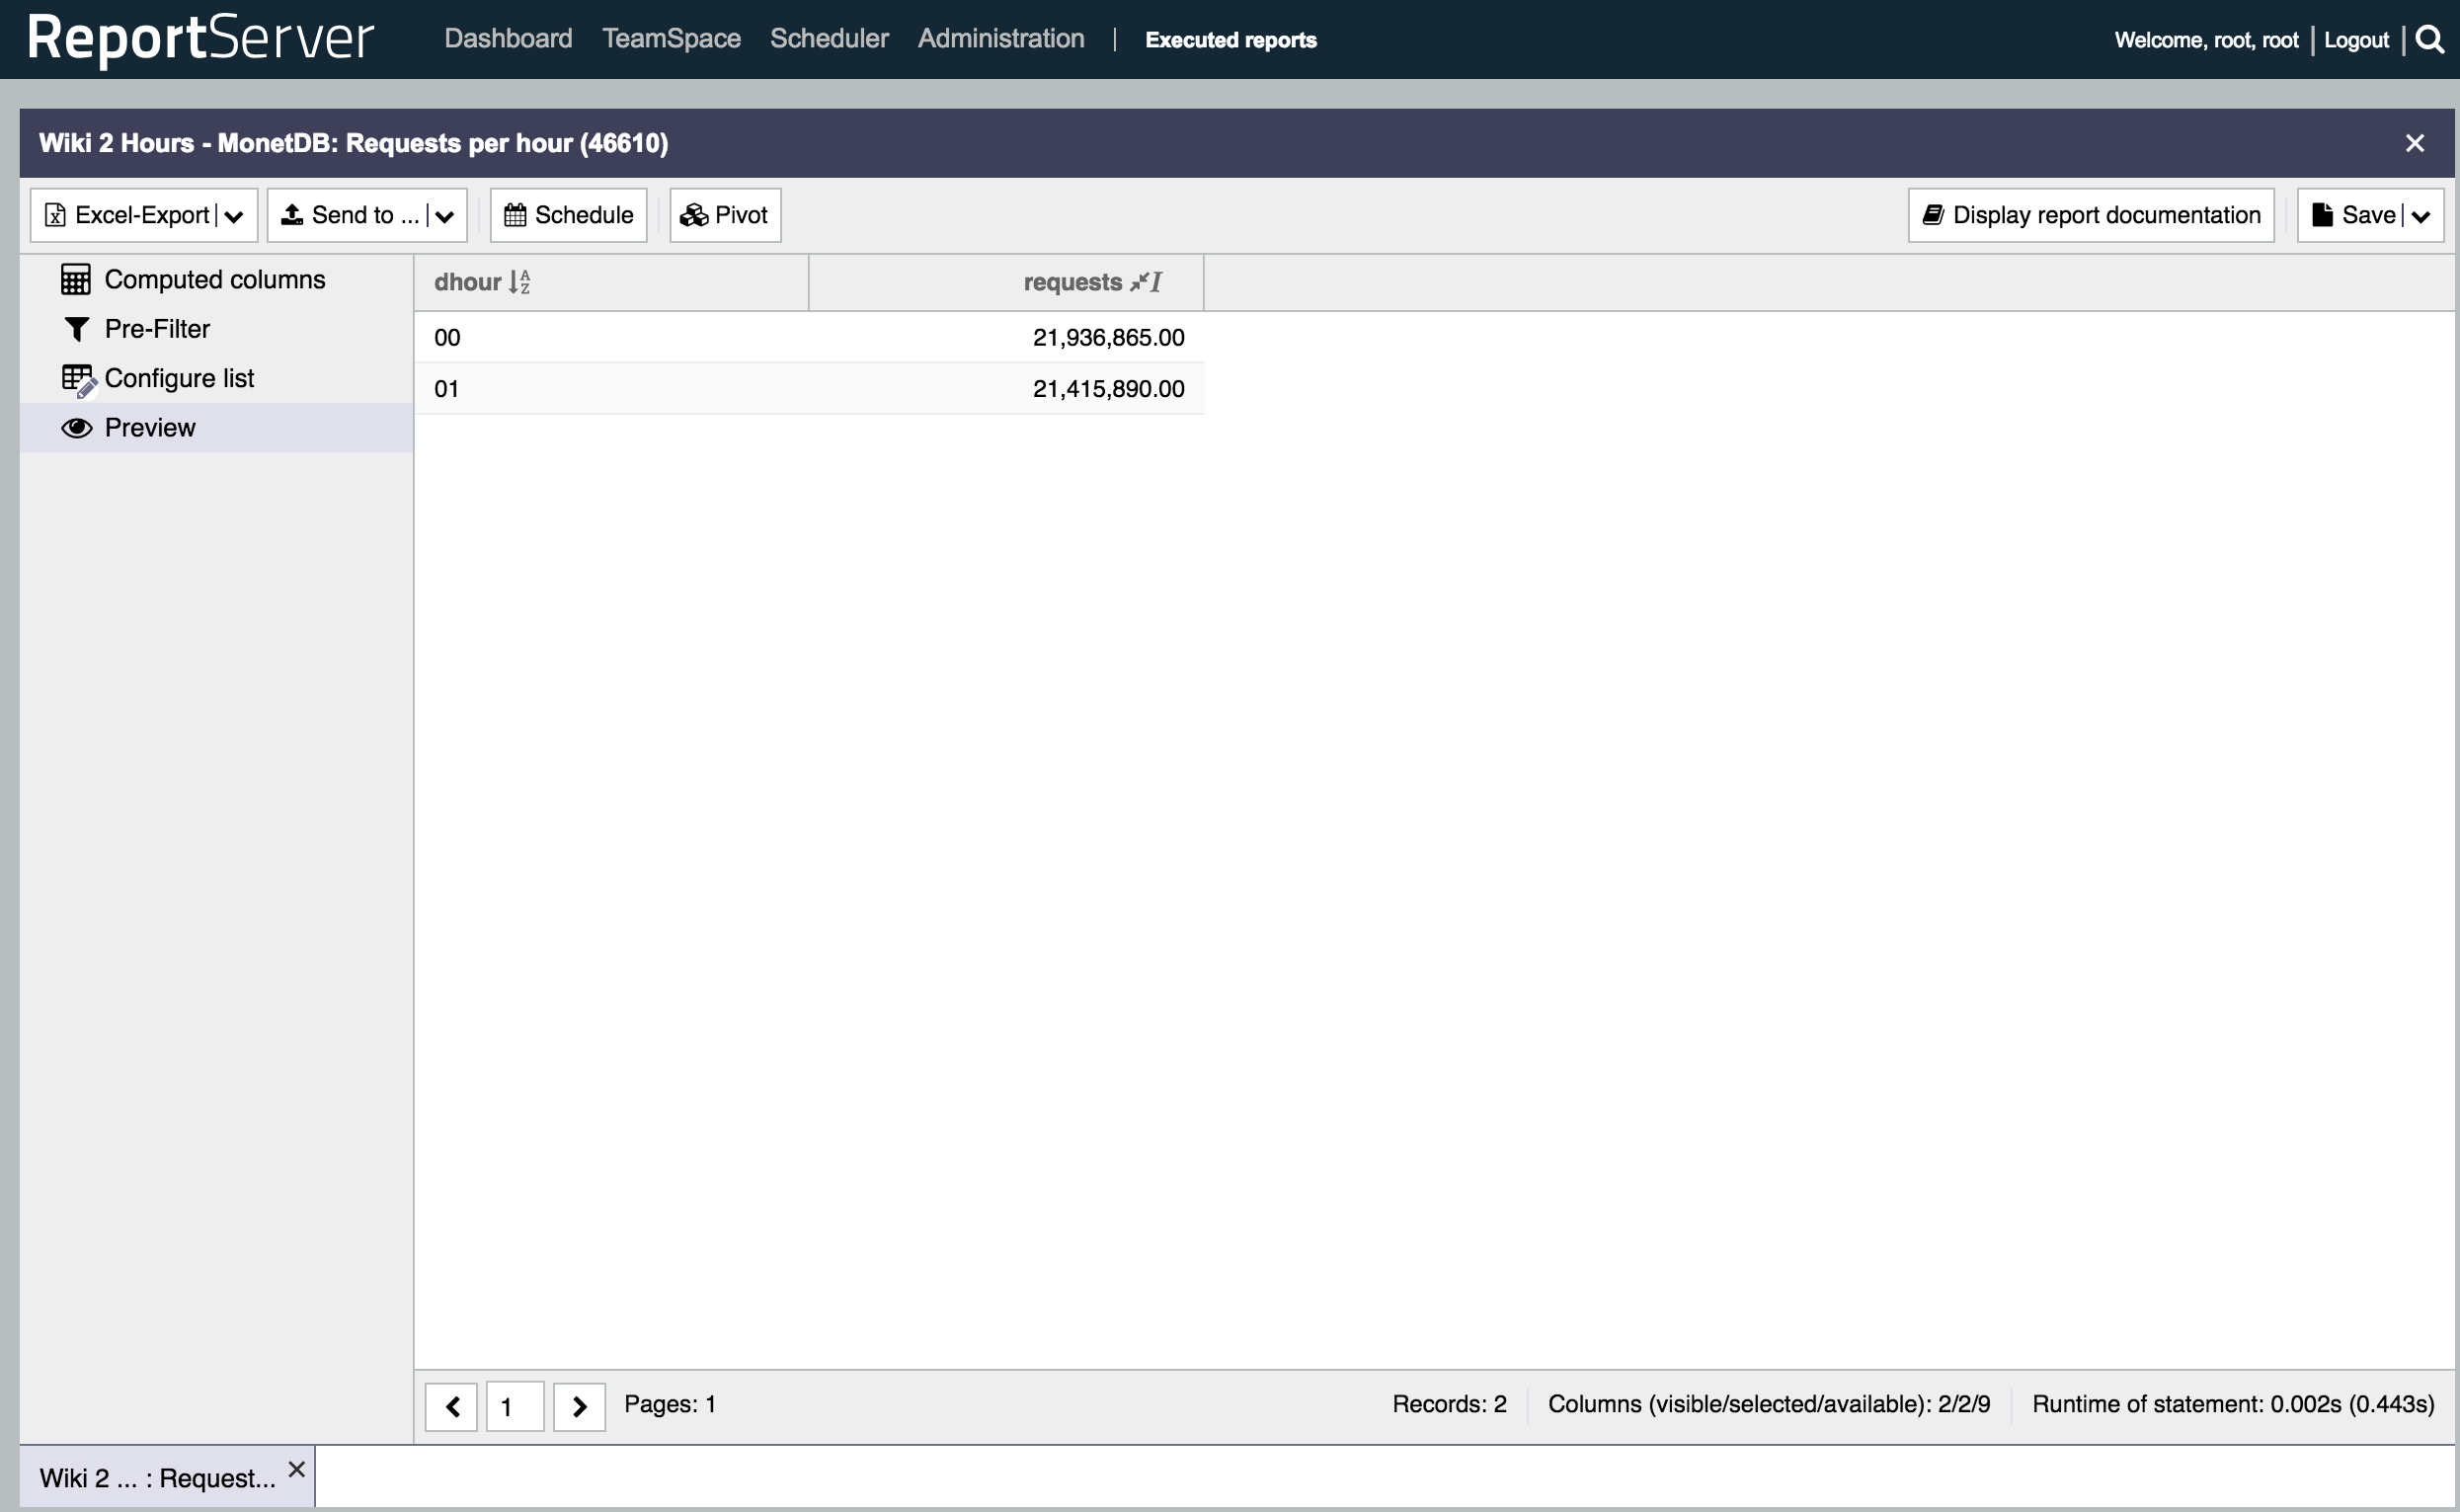
This yields our first test report called: Requests per Hour
A somewhat more elaborate aggregation is to count the number of requests per project (e.g., English Wikipedia) and day and additionally compute the average size of each request and the number of distinct pages that have been accessed during that day. Note that computing the distinct number of pages that are accessed can be regarded as quite a heavy computation and indeed, for all tests simply counting the number of records in contrast to counting the distinct number of pages yields much faster results. This provides us with our second report called Requests per Project and Day. On the first of may (that is with the wiki_one_day table) we have that the English Wikipedia was accessed a total of 150 million times. The number of different pages during that were accessed during that day summed up to a total of . Following is a screenshot of the preview of the results in ReportServer

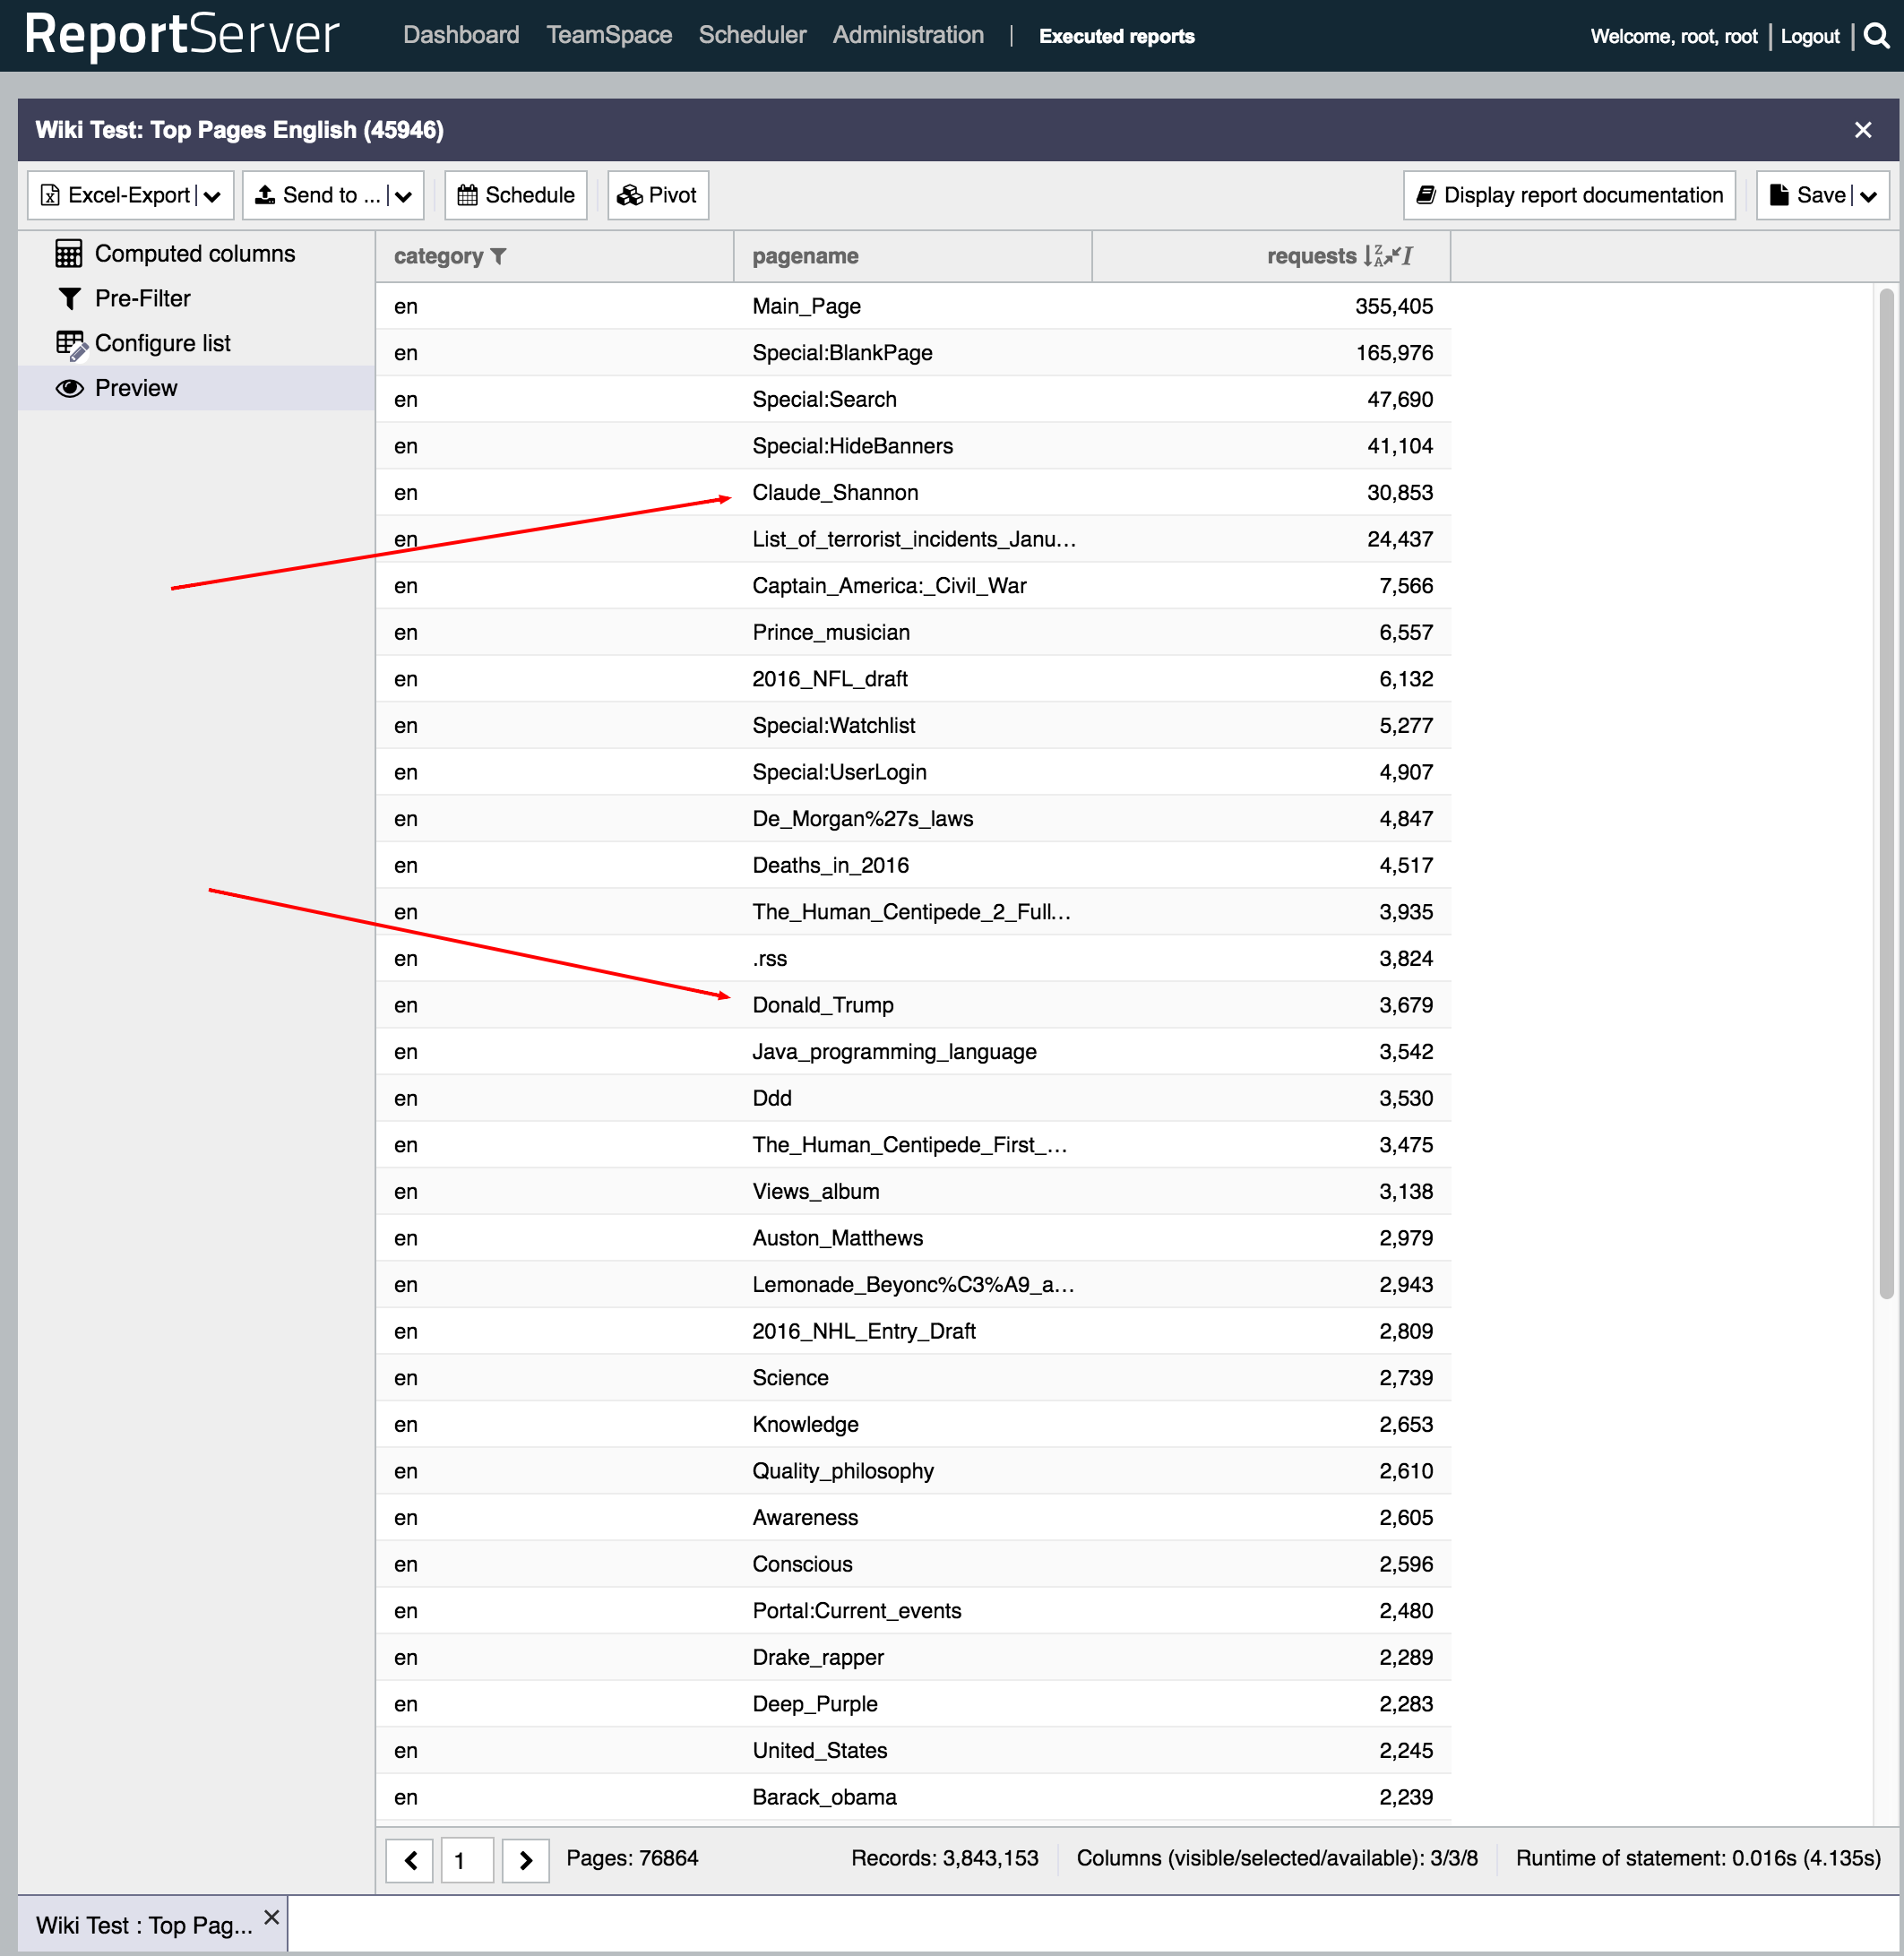
The third report now looks at the top pages of the English Wikipedia and thus reflects the performance of simple filter operations. Interestingly the top page (that is not a special page like the project’s Main Page) for May, 1st was the page for Claude Shannon. That was somewhat unexpected; after all the world usually does not consist of too many information theory enthusiasts. However, this phenomenon is easily explained: April, 30th 2016 marked Shannon’s 100th birthday which was widely acknowledged over the net, not the least by a special Google Doodle. So this yields our third report named Top Pages for English Wikipedia and following is again a screenshot of the results (for the two_hour table).
The data from the top pages also had a second interesting name in the top 50 which is Donald Trump. With the US elections later this year we thought it would be interesting to compare the page views per hour for the pages of Donald Trump and Hillary Clinton. If the numbers of May, 1st have any indication on then, well, see for yourself (the graph is generated with ReportServer’s Pivot mode and on top of the one_day table):
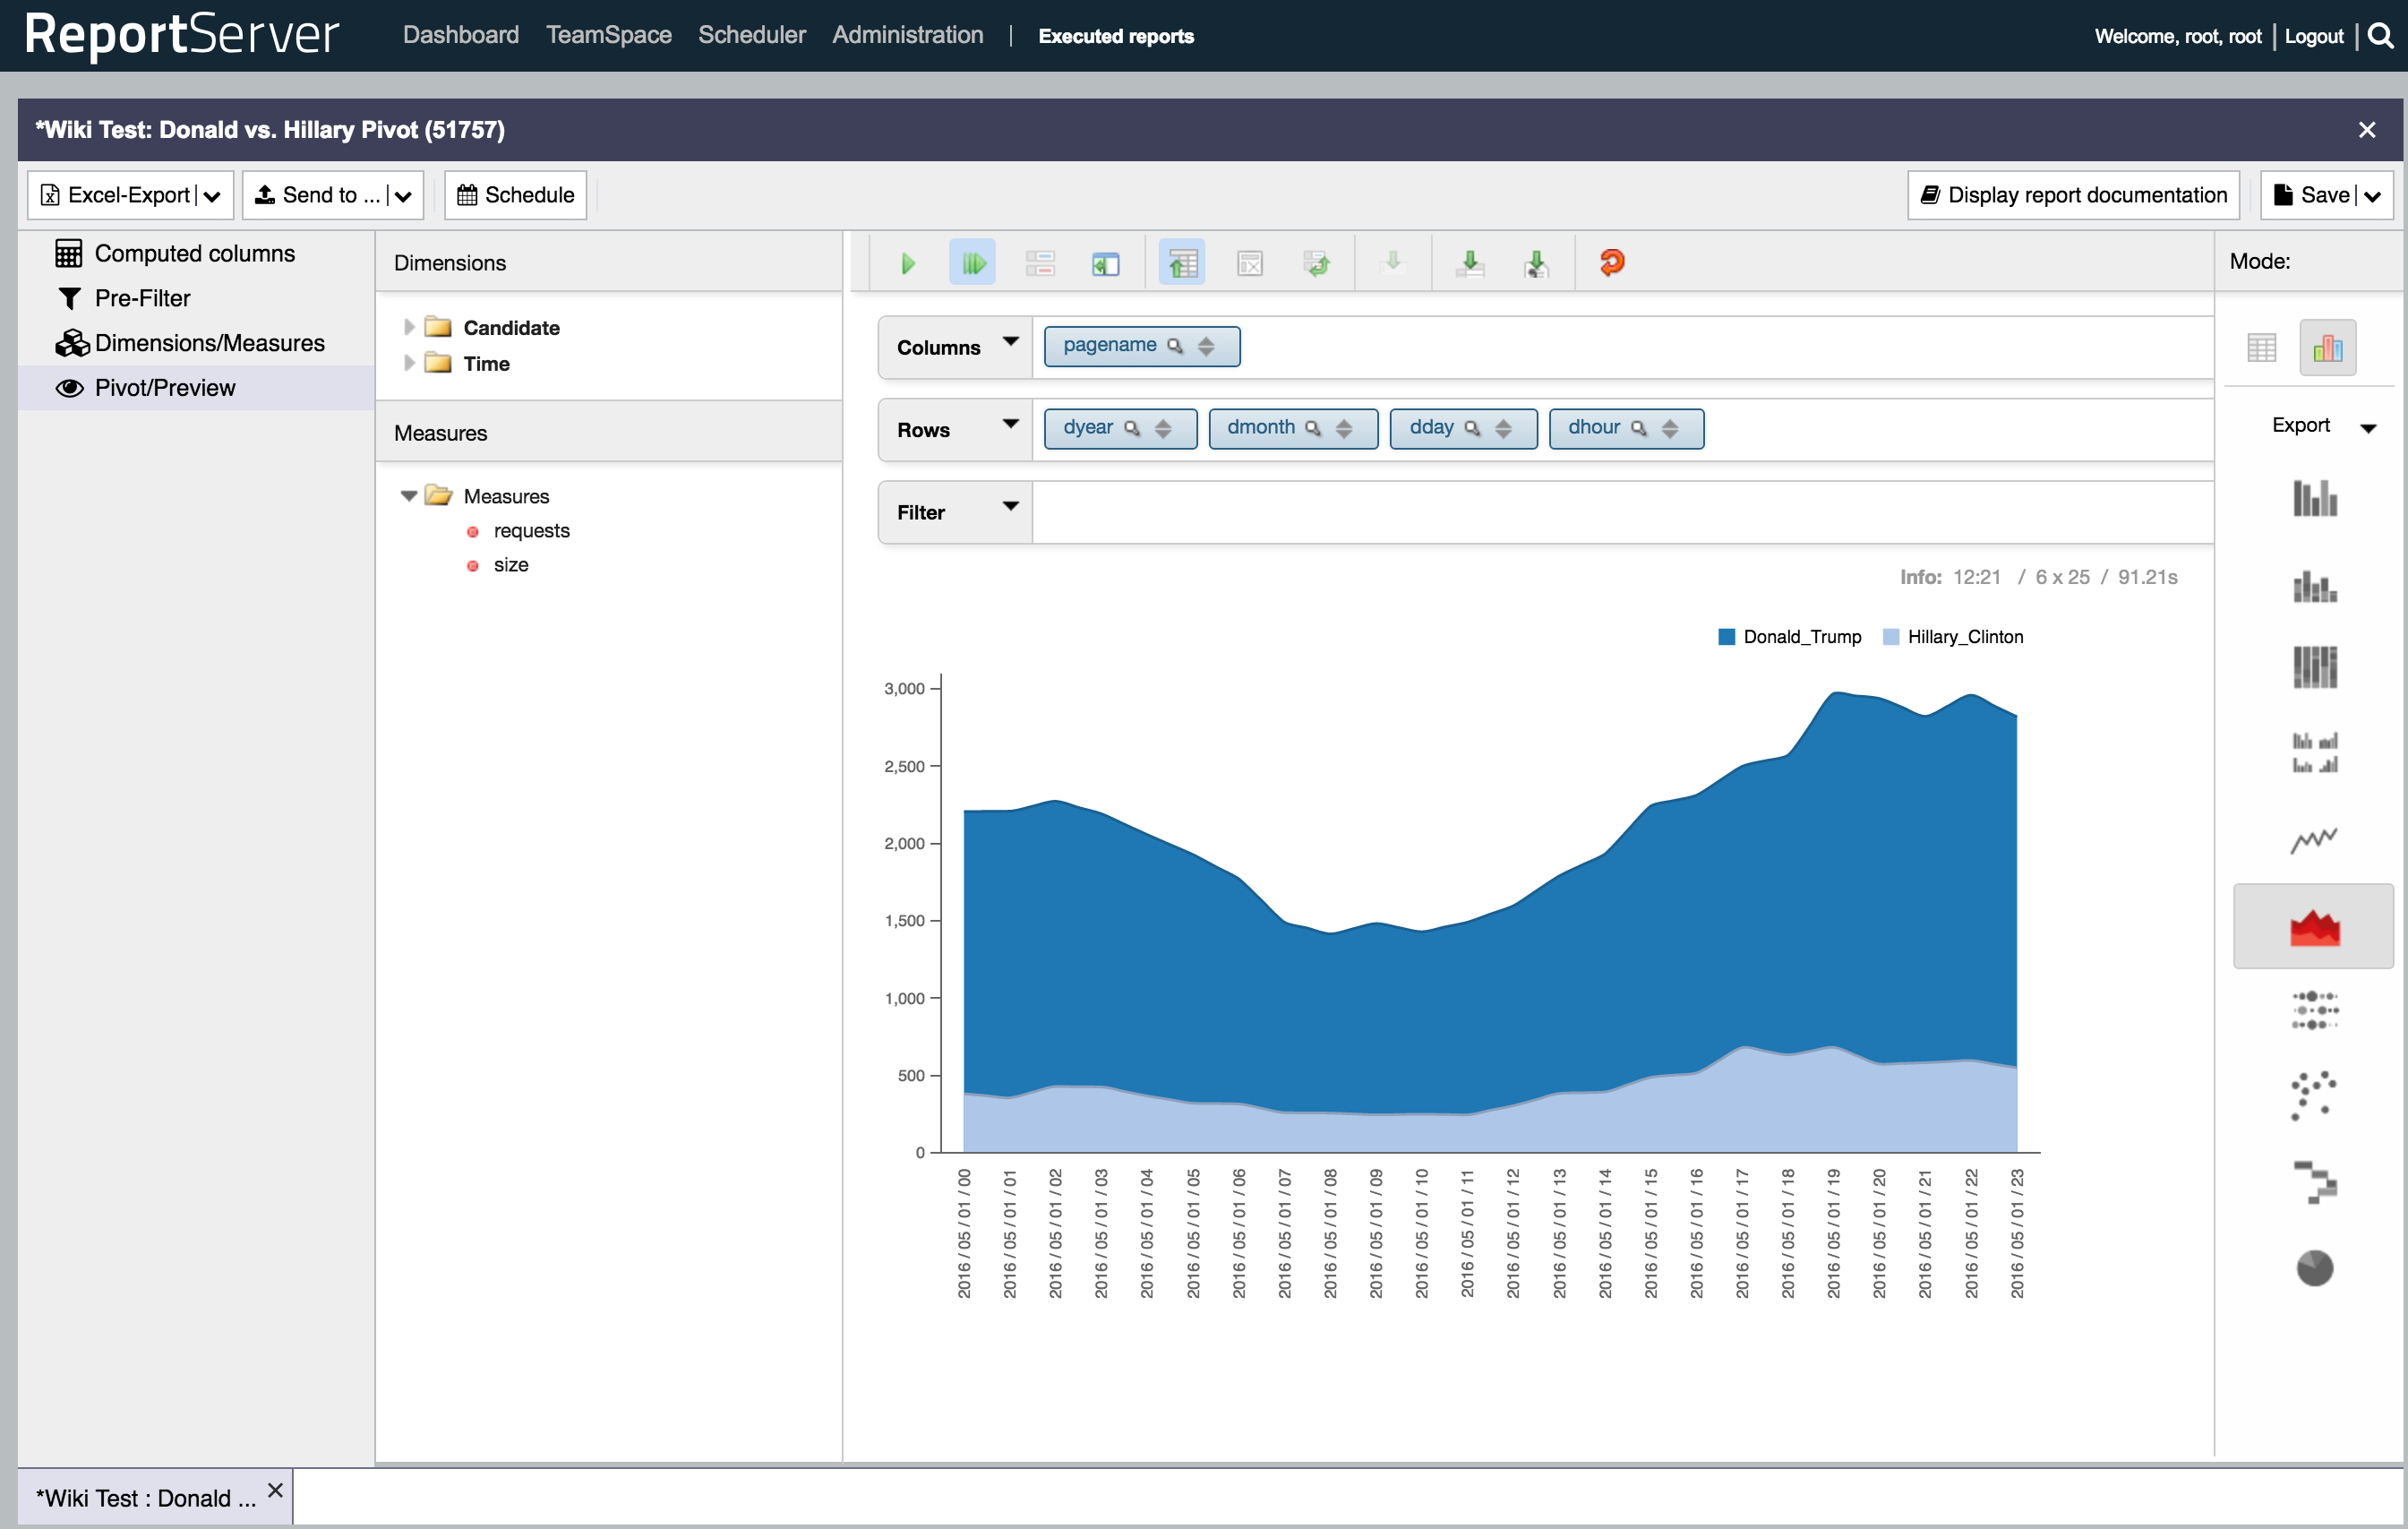
This yields report number four: Donald vs. Hillary.
Finally, we wanted to see how the databases perform when having to compute fields on the fly. The fifth and final report thus contains a simple computed field that assigns to each data record a class indicating the number of requests that it got during that hour. The classes were computed using the following simple case expression
CASE WHEN requests > 2000 THEN 1
     WHEN requests > 1000 THEN 2
     ELSE 3
END
As an interpretation of the class attribute you can think of it as a popularity measure: pages with a class of 1 are very popular (more than 2000 requests within an hour). We have then counted the number of requests per hour and class yielding the following numbers (again the screenshot is for the two_hour table):
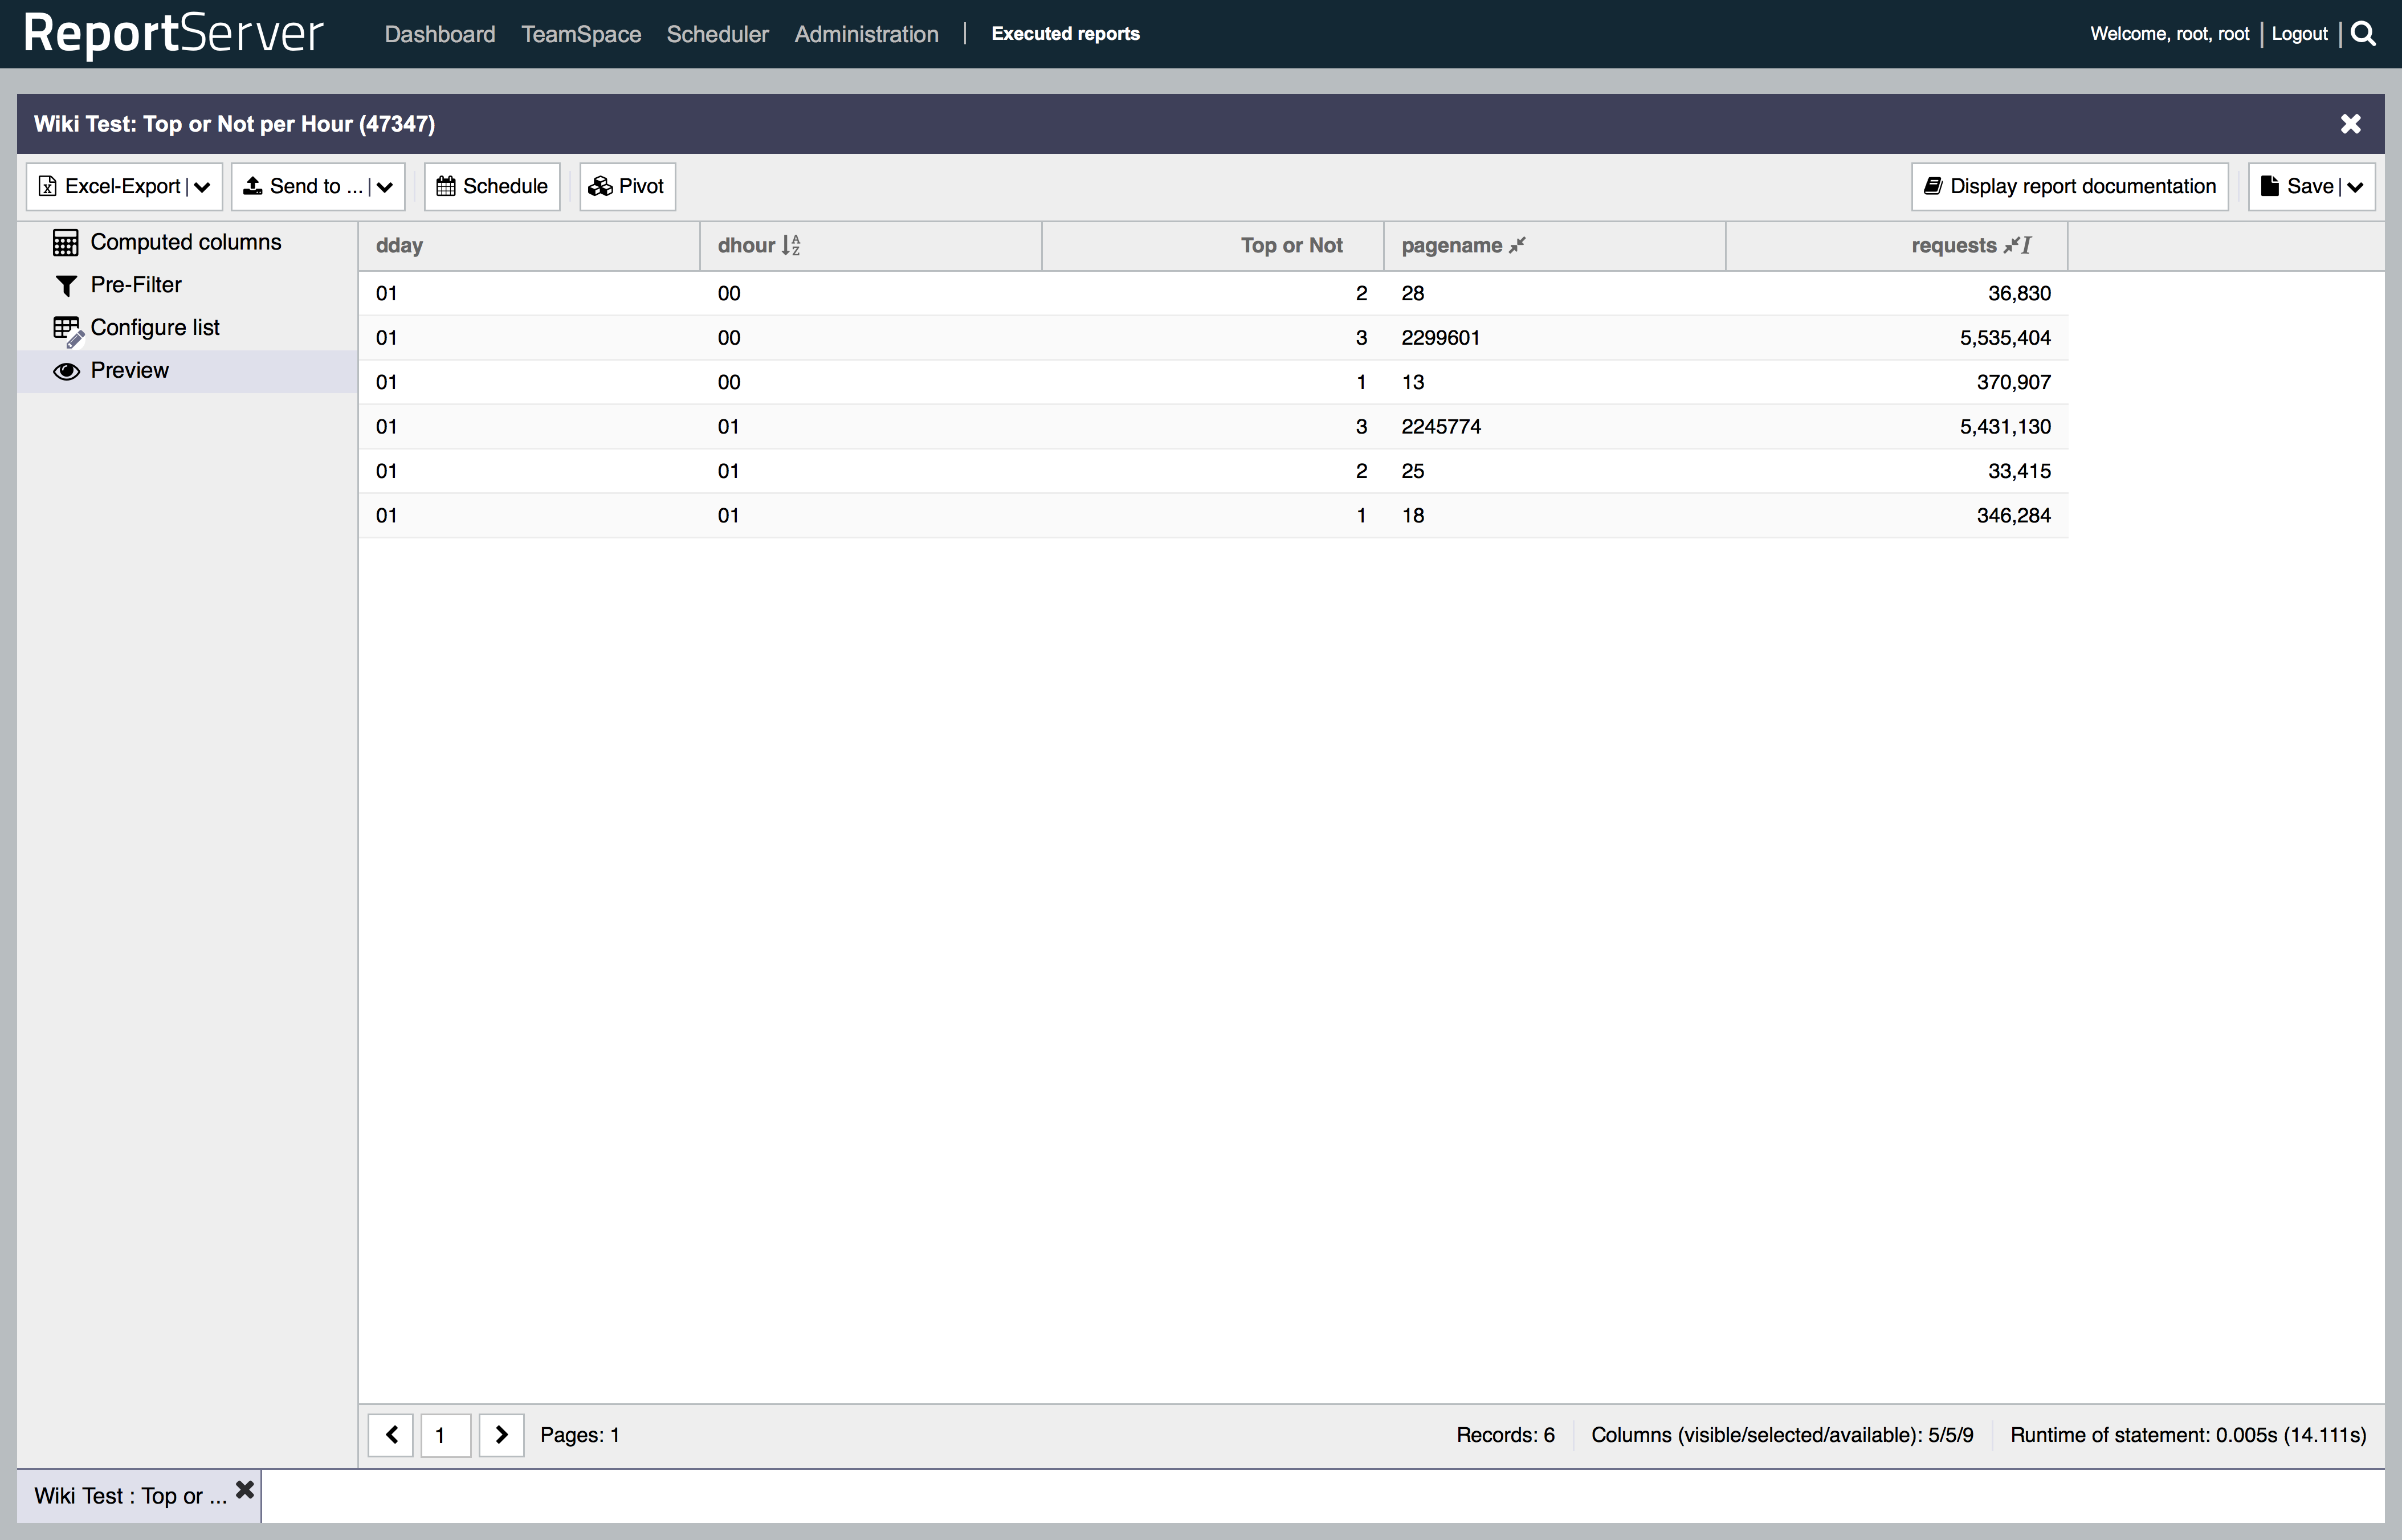
This yields our final report: Requests per Hour and Popularity.
The Results
While the data certainly is interesting, we are of course mainly interested in the performance of the database systems. To measure the performance we exported each report to Excel (except for the Top Pages report, which, due to its size we exported to a CSV format) and measured the full time it took to generate the report. The reports were not entirely computed on an empty cache, that is, first the preview of the report was loaded in ReportServer and then the report was fully executed. The time for the second execution was measured.
There are a few points to note. As discussed above the system used to create the benchmark was a rather small one with 8GB of RAM and 50GB of storage space for the data and temp files. For some of the reports this was simply too restricted a system in order to generate the system. In particular the Requests per Project and Day and the Top Pages reports were problematic. The former, in particular, because of its usage of DISTINCT and the latter because of its sheer result size. For the ColumnStore tests we had to drop the DISTINCT column starting from the Half Day scenario. Furthermore, for the Top Pages report we had to limit the result size (to 100). The adapted tests are marked with an asterisk.
For the InnoDB baseline we have not optimized the queries via creating proper index structures. Furthermore, we only measured the times for the first three scenarios as anything beyond did not fit the storage restrictions. Here the compact and compressed way of storing data employed by MonetDB and the ColumnStore really made a huge difference.
Following is the list of results:
| Report | Scenario | # Selected Records | InnoDB | MariaDB ColumnStore | MonetDB |
|---|---|---|---|---|---|
|
Requests per Hour
|
2 Hours | 2 | 46,59s | 2.74s | 0.25s |
| Half Day | 12 | 265.90s | 15.73s | 1.01s | |
| One Day | 24 | 509.34s | 36.44s | 3.14s | |
| Two Days | 48 | — | 70.53s | 10.30s | |
| Three Days | 72 | — | 110.35 | 21,16s | |
|
Requests per Project and Day
|
2 Hours | 1,165 | 46,73s | 31.07s | 5.86s |
| Half Day | 1,245 | 265.63s | 67.52s** | 143.13s | |
| One Day | 1,286 | 511.20s | 119.62s** | 972.16s | |
| Two Days | 2,610 | 249.53s** | 2,605.26 | ||
| Three Days | 3,907 | 388,63s** | FAILED* | ||
|
Top Pages English Wikipedia
|
2 Hours | 3,843,153 | 318.89s | 302.02s | 41.23s |
| Half Day | 11,184,777 | 362.62s*** | 57.95s*** | 130.76s | |
| One Day | 18,478,357 | 707.52s*** | 138.00s*** | 275.56s | |
| Two Days | — | FAILED* | FAILED* | ||
| Three Days | — | FAILED* | FAILED* | ||
|
Donald vs. Hillary
|
2 Hours | 4 | 46,61s | 1.85s | 1.54s |
| Half Day | 24 | 256.65s | 11.85s | 94.40s | |
| One Day | 48 | 508,77 | 38.41s | 204.93s | |
| Two Days | 96 | — | 77.30s | 212.68s | |
| Three Days | 144 | — | 116.94s | FAILED* | |
|
Requests per Hour & Popularity
|
2 Hours | 6 | 46.63s | 6.56s | 0.42s |
| Half Day | 36 | 265.63s | 36.15s | 2.13s | |
| One Day | 72 | 509.11s | 73.89s | 5.16s | |
| Two Days | 144 | — | 156.90s | 17.48s | |
| Three Days | 216 | — | 241.99s | 33.99s |
*Ran out of memory and swap space.
** The DISTINCT column was dropped from this test.
*** Result set was limited to 100 records
Conclusion
The results are of course not conclusive. We looked at a very restricted use case and furthermore had a very restricted environment in which the tests were performed and did not try to fully optimize the configuration for each of the database systems. While MonetDB has only very few configuration parameters and simply tries to make the best of whatever resources the system offers (for example, there is no disk or memory limit) MariaDB has quite an elaborate configuration which we did not try to optimize. Furthermore, the MariaDB ColumnStore is still in an alpha status.
Nevertheless, the tests provide some interesting insights. To start with, MonetDB shows some exceptional performance especially on this downsized system. While for most of the reports MonetDB outperformed the ColumnStore, the picture was reversed for the Donald vs. Hillary setting. The main difference between this report and the others was that the focus here was on first filtering out a small number of data rows, while for the other reports the focus was mainly on aggregating large amounts of data. Also interesting is the Requests per Project and Day report which from scenario two on (the 70 mio row scenario) did no longer work as is with MariaDB’s ColumnStore. That is, we had to take out the distinct count aggregation in order to get results. With InnoDB however, there was no such problem. In fact in the one day scenario InnoDB even outperformed MonetDB on this report.
In summary, we have seen two very interesting open source column store databases and the outlook for MariaDB’s new ColumnStore is definitely a promising one. Furthermore, MonetDB shows some exceptional performance on aggregation heavy queries. We can thus only encourage you to have a closer look at both MonetDB and MariaDB’s ColumnStore for your next (ReportServer) project. Until then,
Happy Reporting!