Have any questions?
+44 1234 567 890
ReportServer 3.0 is out and in this post we want to tell you all about it.
We are happy to announce the release of ReportServer 3.0 which, for the first time, comes in two different editions: ReportServer Community Edition and ReportServer Enterprise Edition. While this, in itself is a huge change, and you can read all about it in this blog post, here, we want to tell you about the new features available in ReportServer 3.0
A New Theme
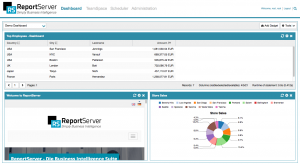
The biggest change that you will notice right away is that we’ve put considerable effort into creating a new modern look for ReportServer:
However, it is not just a single new look! ReportServer 3.0 (Enterprise Edition) is fully themeable and it is easy to adapt the look and feel of ReportServer to match your corporate identity. Switch colors by simply specifying a few lines in a config file. Or, if you like to really dig in, you can easily add custom changes via CSS. You liked the old brownish look? Try our retro theme:
Or what about a bit of ReportServer petrol-green?
Themeable HTML and PDF exports for Dynamic Lists
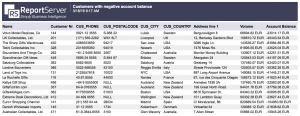
With the new theming capabilities we have also extended the PDF and HTML export of dynamic lists.
Changing the ReportServer theme, also adapts the look and feel of Dynamic List exports. You can, however, go one step further and introduce custom CSS or add additional information with custom HTML or even add custom javascript.
Dashboard
ReportServer Dashboards provide a fantastic way to concisely present data and key performance indicators. With the new version, we have extended the dashboard functionality to allow you to create even more powerful dashboards in minutes.
New Layouts
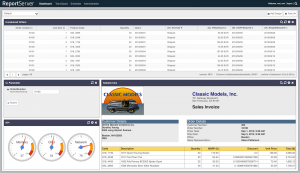
So far, ReportServer Dashboards were layed out in columns. You could choose between a single column layout, various two column layouts or a three column layout. The new version comes with a neat addition. In addition to the base layout which is still column based, there is an extra container on the very top and bottom which is as wide as the screen. This allows you to mix full width dadgets with the old layout capabilities to, for example, generate a layout like this:
A second new layout feature in dashboards is that you can now choose between a dashboard being scaled or not. Traditionally, ReportServer dashboards where not automatically resized to fit the screen. With ReportServer 3.0 you can now choose to scale dashboards. This means that ReportServer will make sure that the dadgets match your screen size (i.e., no scrollbars are visible) and that they are sized relatively to one another. For example two dadgets are layed out such that the top one gets a third of the available space and the bottom one the remaining two thirds.
Refresh Intervals
A common request for the use of dadgets was that they can be configured to reload every now and then. While this could be emulated with the old version of ReportServer, it was rather cumbersome to write the necessary java script code and use HTML dadgets instead of the simple to configure report dadgets. With ReportServer 3.0 all dadgets can be easily configured to periodically reload their content after a specified amount of time.
Dashboard Parameters
In the past, when reports had parameters, they were not really suited to be on the dashboard. Yes, you could include the full report execution view which allows to set parameters, but this didn’t quite feel natural. And what if you had multiple reports that all took the same parameter (say a year) and you wanted to display all the information together?
With ReportServer 3.0 we solved both problems. On the one hand, the report dadget now allows to easily set the parameters with whatever output format you have specified. In addition, there is a new “Parameter Dadget” which collects the parameters from all the reports that have been placed on the dashboard and displays them. Of course, if two reports share the same parameter (say allow to select a year) it will be displayed only once in the parameter dadget. And, yes, updating the parameters, updates all reports.
Parameters
While we are at the topic of parameters, there have also been a few notable additions.
Mandatory Parameters
We have introduced the concept of mandatory and optional parameters. By default every parameter is optional, but now you have the option to mark one or more parameters as mandatory. When a user opens a report in ReportServer the parameters of the report are displayed first. In case a parameter is marked as mandatory a user can only continue with the execution of the report (or configuration of the remainder of the report) after a value for the parameter was selected.
Label Width
For each parameter you can now specifiy the width of the label, giving you much more control about how the parameter page is rendered.
File Upload Parameter
A new parameter type that we added to ReportServer is the file upload parameter. This allows your users to upload files which can subsequently be used by the report generator. This is especially powerful in combination with script reports and allows to implement powerful mini apps directly from within ReportServer.
New Versions of BIRT and Jasper
With ReportServer 3.0 we have updated to the current versions of Eclipse BIRT (4.5.0) and JasperReports (6.2.0).
Grid Editor
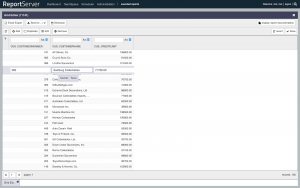
The Grid Editor component of ReportServer Enterprise is not a report type in the classical sense. It is rather a very flexible spreadsheet like database editor that can be used in situations where you want to enable a user to do some basic data administration. Once defined the grid editor can be used as any report, that is, it can be used by users in their TeamSpace and users can even export the underlying data to Excel and schedule the report.
The Grid Editor is backed by a ReportServer script that can be as simple as the following, which was used to generate the editor visible in the above screenshot.
def adapter = gridHelper.initDbGridEditor() adapter.configure(report,"T_AGG_CUSTOMER") .setPk('CUS_CUSTOMERNUMBER') .columns() .add('CUS_CUSTOMERNUMBER') .add('CUS_CUSTOMERNAME') .add('CUS_CREDITLIMIT') .done() return adapter;Basically, all you need to do is to describe the columns that you want to display. Of course the possibilities don’t end here. For a complete description of the capabilities have a look at our documentation.
Support for Automated Installations
With ReportServer 2.2 some configuration files (for example, the persistence.xml file configuring ReportServer’s database) were located within ReportServer’s web directory. When automating the installation of ReportServer this made it somewhat cumbersome as the configuration needed to be adapted after extracting the ReportServer zip file. Also it made updating ReportServer more error prone. Now you can load the configuration files that are not stored within ReportServer’s internal file system from any external location.
Custom Send To/Schedule Targets
So far, ReportServer allowed to either export reports directly, to send them via email, or to export them to the TeamSpace. With ReportServer 3.0 you can now add custom execution targets. For example, you can export reports via SFTP or send reports to a document management system. Of course, any custom target is not only available as a direct export but can also be used when scheduling reports.
A new Internal DB
The internal DB is what powers script datasources as well as CSV datasources. In the past, the internal DB was backed by the file-based H2 database. With the upcoming release we have reimplemented most of the functionality and, in particular, made the functionality independent of the H2 database. Instead, you can now configure what database should be used as backend. This not only makes the internal DB much more flexible but it also increases performance significantly.
Support for Additional Databases
We have added direct support for additional databases including MariaDB and the fantastic column store MonetDB. If you are in the need for a backend that easily supports hundreds of millions of rows and is perfectly suited for the Dynamic List you should definitely give MonetDB a test spin.
Hundreds of Small Improvements
And of course, over the past year, we included literally hundreds of minor improvements and fixes. For a full list see the release notes of ReportServer 3.0.
So much for a first glimpse of ReportServer 3.0. We are looking forward to hearing your thoughts and comments.
Your ReportServer Team


