Chapter 6. Dynamic Lists
The Dynamic List is ReportServer's tool of choice when it comes to fast, user-specific reports/analyses, or when the focus is on subsequent processing of the data.
From simple data selection using column selection and filters, through sorting, grouping, or subtotals, up to complex analytical functions, the Dynamic List can cover almost any reporting requirement.
Once specified, you can store your report as a so called variant and share it with your coworkers via a TeamSpace. When you open a Dynamic List for execution, you are taken to the report area, where you can configure the evaluation and finally execute it.

The basis of every Dynamic List is a source table provided by an administrator. This table is typically very comprehensive and can easily contain hundreds of columns and several million rows. To derive information from this data, it is necessary to select the data to be considered. For this purpose, ReportServer provides a variety of tools that allow even complex selection conditions to be formulated intuitively.
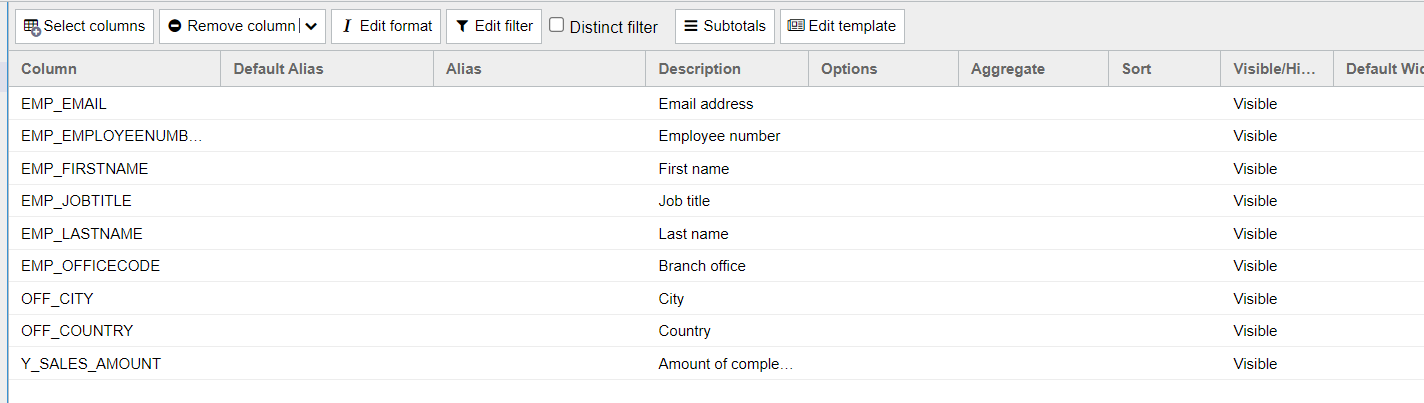
The first step when creating a new Dynamic List is selecting the columns to be used. You can access column selection via the toolbar of the aspect. This opens the well-known selection dialog (see Chapter ). The dialog lists all available columns for selection.
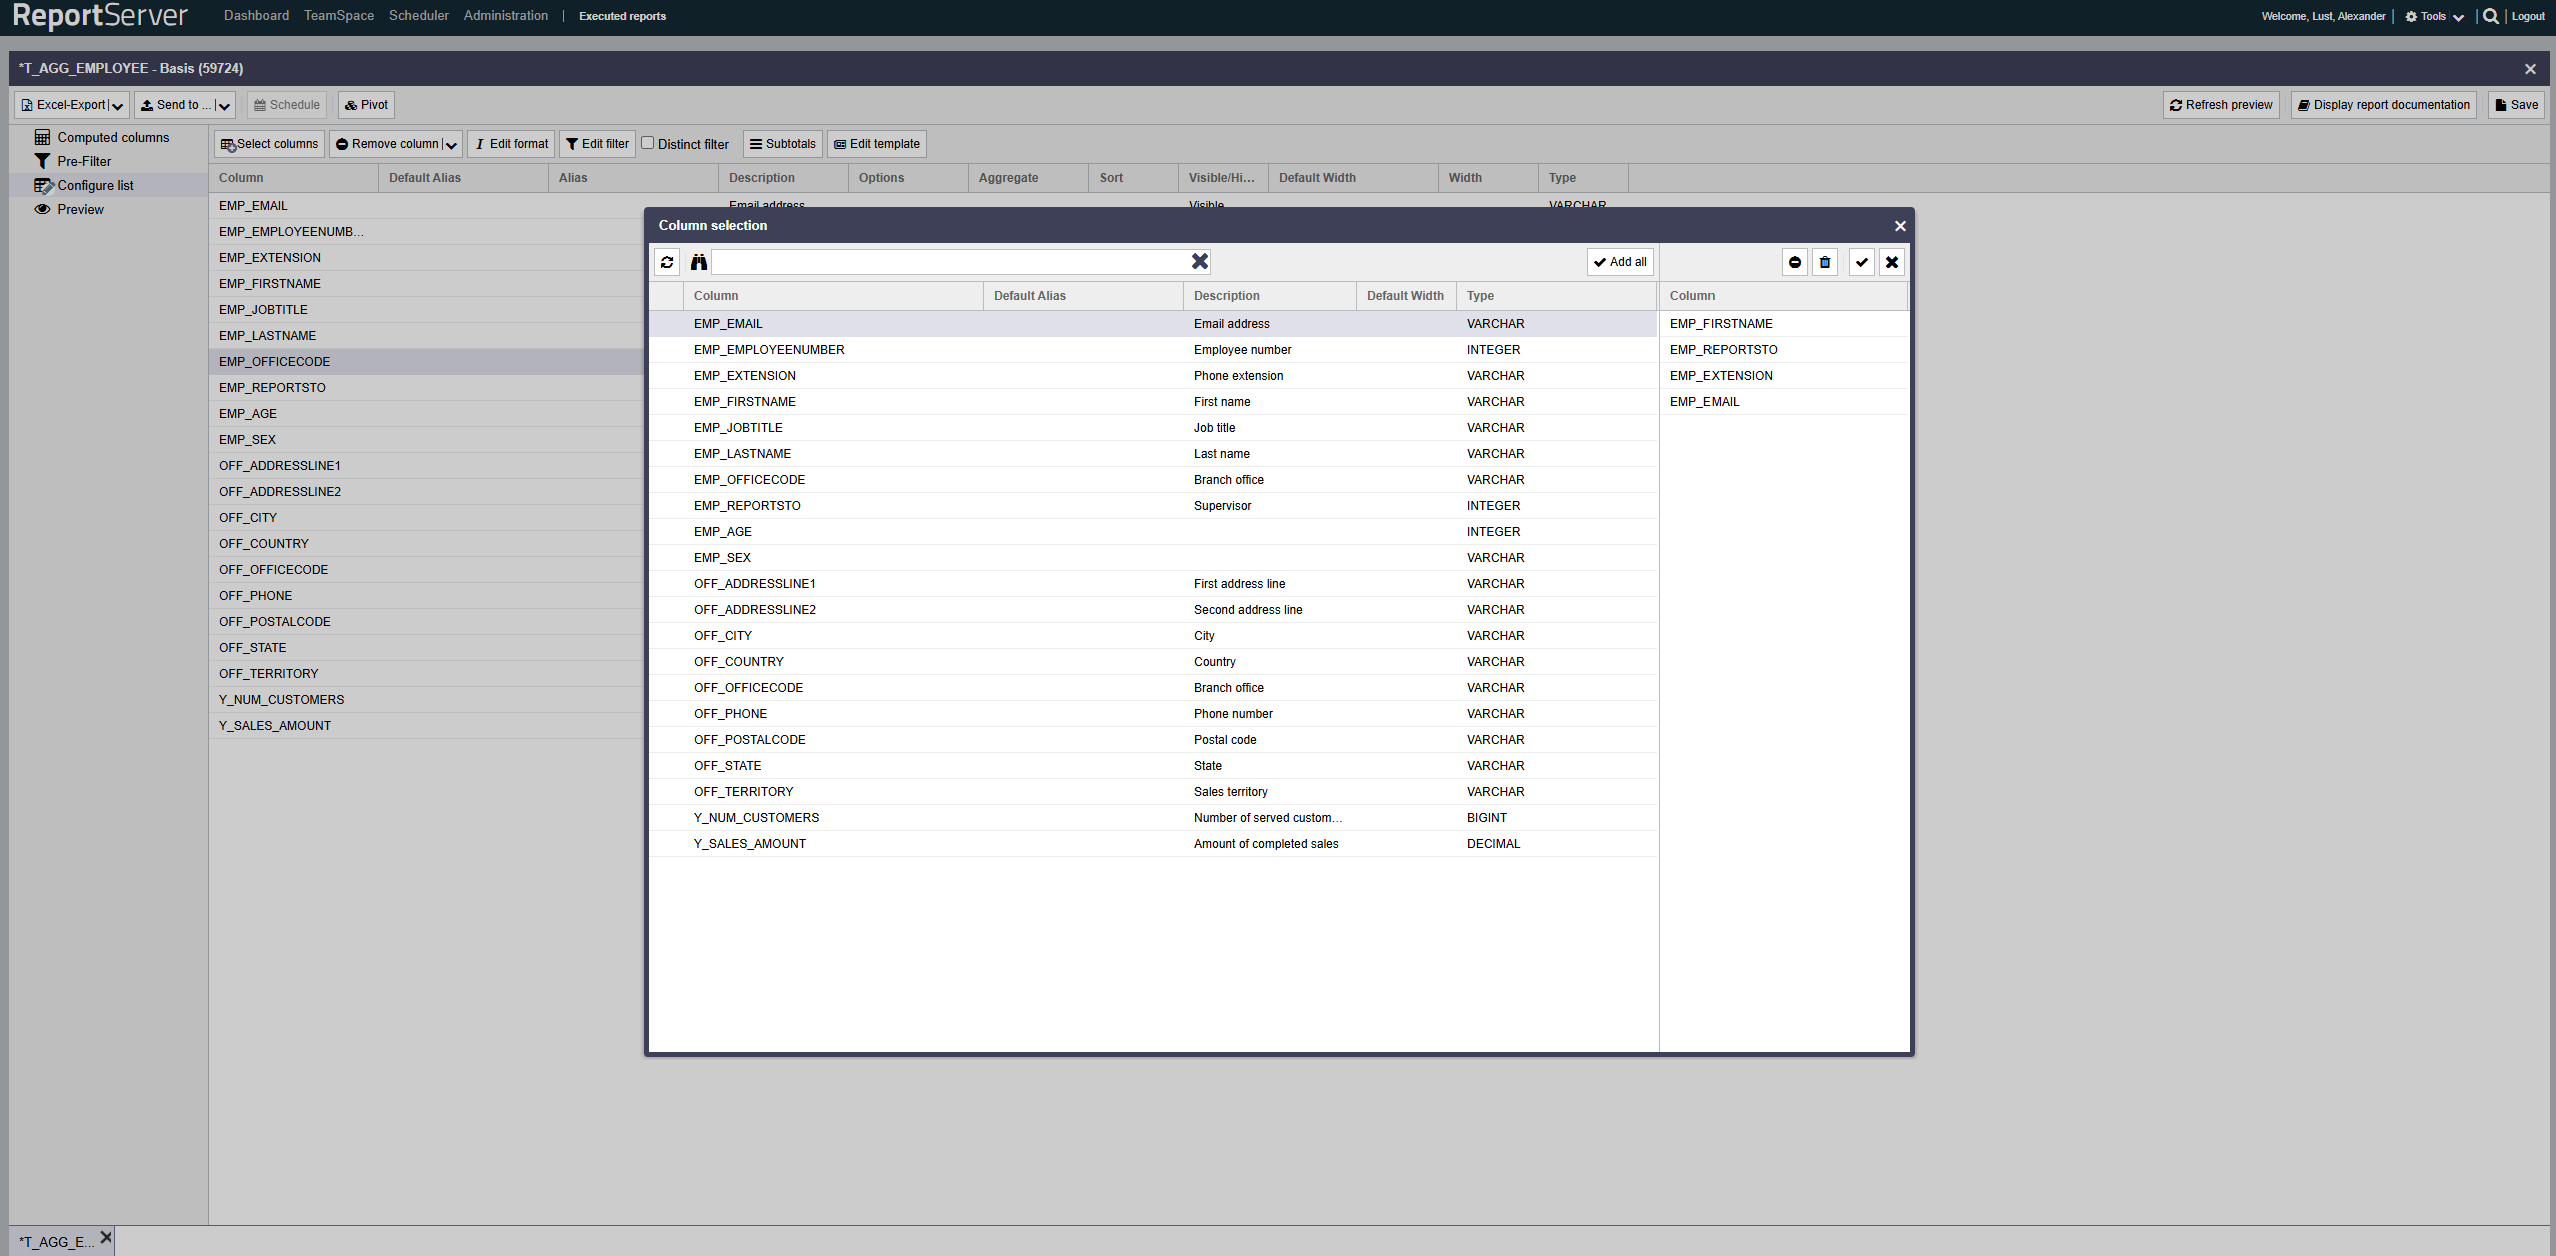
The selected columns are transferred to the aspect.
For each selected column, the following information is displayed:
| Column | The technical name of the column. |
| Default column name | A possibly predefined plain-text name. |
| Column name | Here you can assign your own name/alias for the column. |
| Description | If available, contains an explanation of the meaning of the column. |
| Options | Indicates the applied configuration via icons. |
| Aggregation | Allows aggregation on this column; see Section Aggregation. |
| Sorting | Allows sorting the data by this column. |
| Hidden | Using the option, the column can be hidden. |
| Type | Specifies the underlying data type. |
Each column in a database is assigned a fixed data type, which determines the type of content possible in that column. There are different data types, e.g. for text, numbers, and dates. Common data types include:
| VARCHAR | Text with a fixed maximum length |
| INTEGER | An integer |
| DOUBLE/FLOAT | A floating-point number |
| DECIMAL | A decimal number |
| CLOB/BLOB | Arbitrarily long text / binary data |
| DATE | A date, possibly including time |
The order of the columns in the final report corresponds to the order of the columns in the list configuration. You can change the order via drag-and-drop or via the context menu.
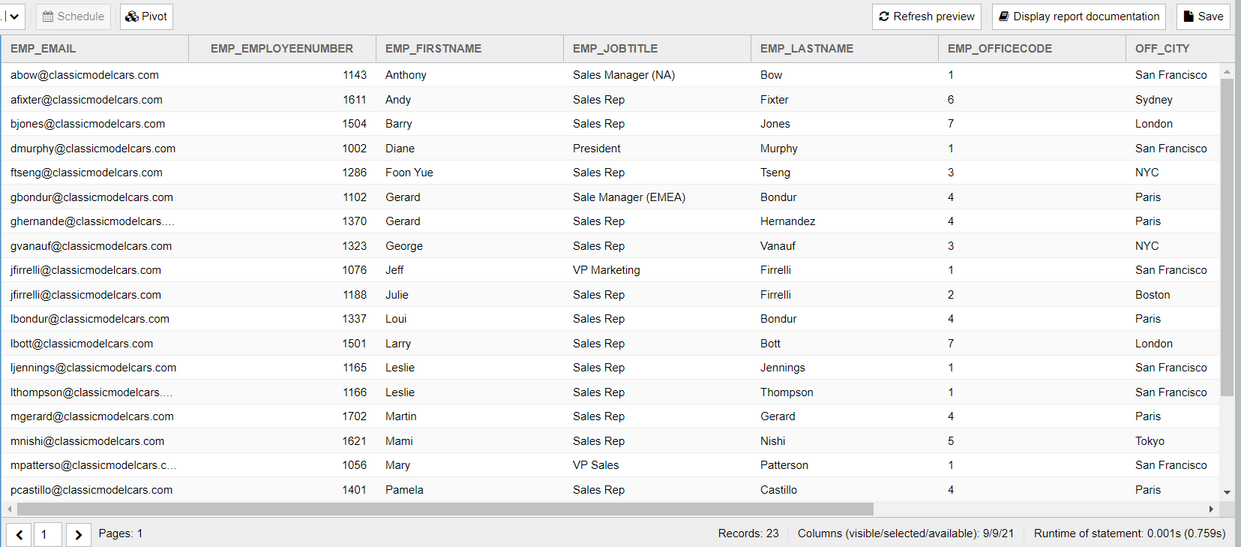
To retrieve the data returned by the report in the current configuration, switch to the Preview aspect. In the preview, the first 50 rows of your configured list are displayed. The preview toolbar (at the bottom) shows information about the selected data. This includes, in addition to the total number of available records, information on column selection and runtime. The runtime is split into pure server time and the duration of the entire request. Use the and buttons to page through the result.
Double-clicking a row opens the selected record in a new window for a detailed view. For quick configuration adjustments, many functions of the List configuration aspect are also available via the context menu of a data cell.
To change the name of a column, you can assign an alias in the list configuration. To do this, click the corresponding cell under Column name and enter a new name.
Depending on the configuration, a suggested name may be stored for a column. If available, it is shown in the column. If you set your own column name, it overrides the default.
You can set the sorting of records in the final report under for each column. If multiple columns are configured for sorting, the sorting priority follows the order of the columns.
In the column you can exclude individual columns from display. This is useful if you want to use a column for filtering or sorting but do not want it to appear in the output.
Filters allow you to restrict the report data at the row level by defining inclusion and exclusion criteria per column. This section covers the basics of filtering. More advanced options, such as filtering with placeholders or formula expressions, are introduced later in this chapter. To define a filter condition on a column, select it in the List configuration aspect and open the filter dialog by double-clicking or via the corresponding toolbar button.

Starting from the base data set, you have two basic options for selecting the records to be considered.
- Select the subset to include: These records are included in the final report (inclusion)
- Select the subset to ignore: All records except the selected ones are included in the final report (exclusion)
If you define both inclusion and exclusion filters, the exclusion no longer applies to the full base set, but to the set selected by inclusion. In particular: if you explicitly both include and exclude a single value, it will not be part of the result set.
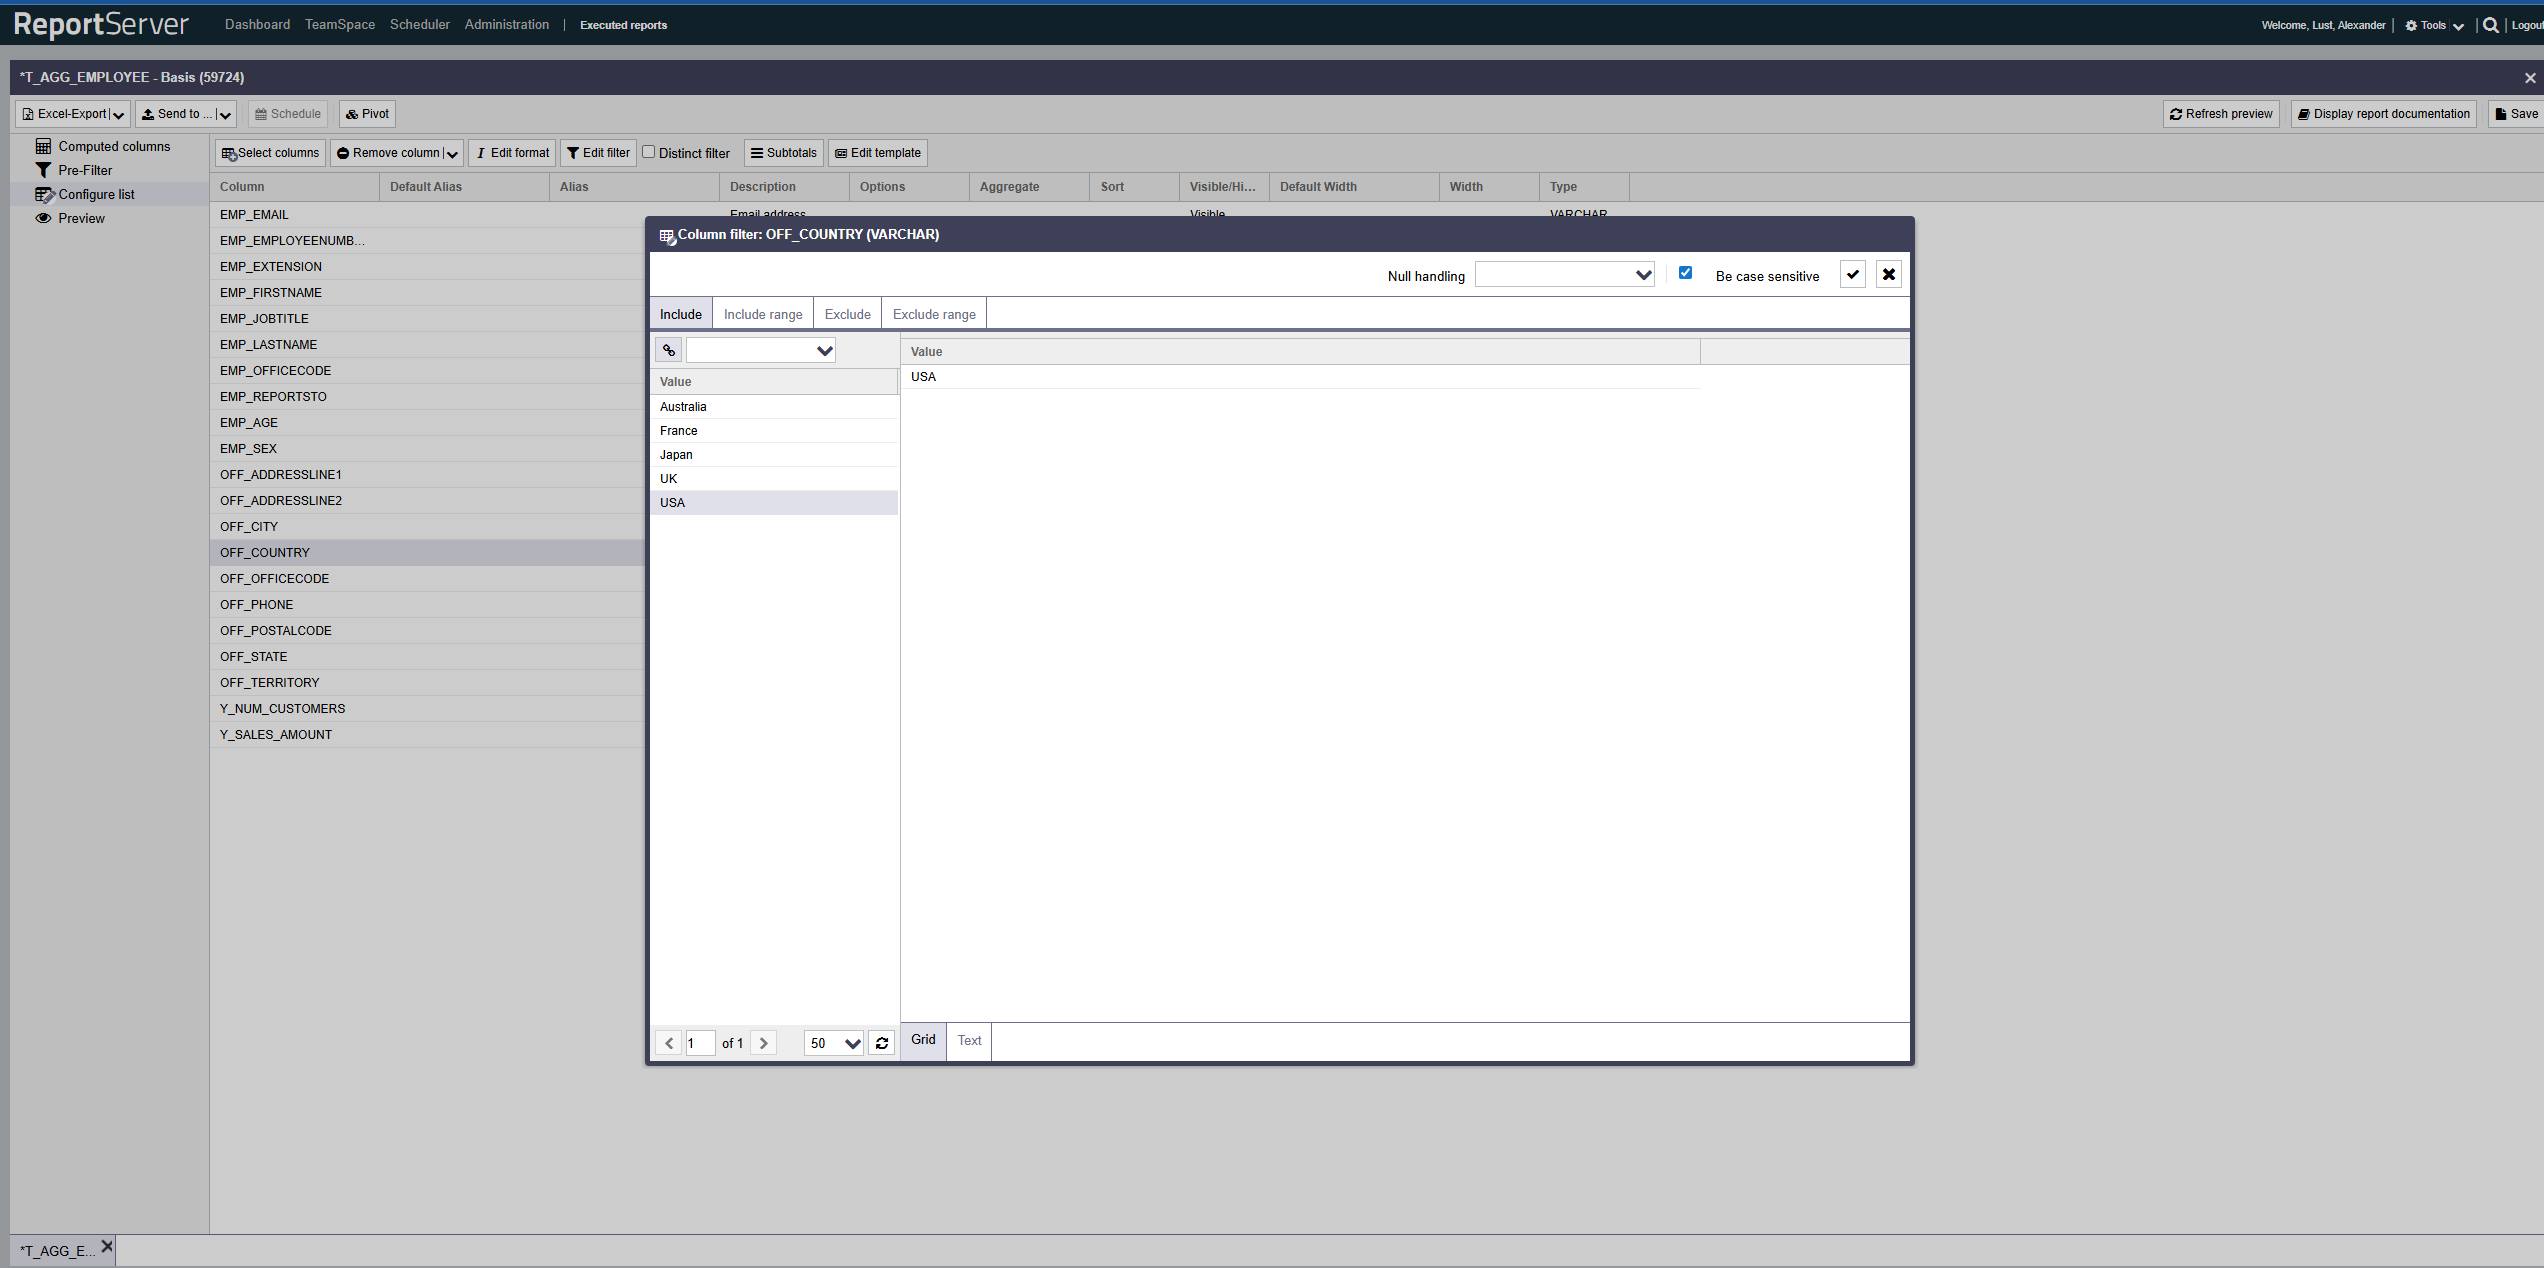
The filter dialog allows you to define inclusion and exclusion filters both based on individual values and on value ranges. Use the corresponding tabs.
The structure of the individual tabs is essentially the same and resembles the familiar selection dialog. On the left side you find the column values based on the currently configured base set, which may already be restricted by other filters (both on the current column and on other columns).
As in the selection dialog, values can be transferred to the selection via double-click or drag-and-drop. For inclusion/exclusion of ranges, two consecutive selections are combined into a range (from A to B).
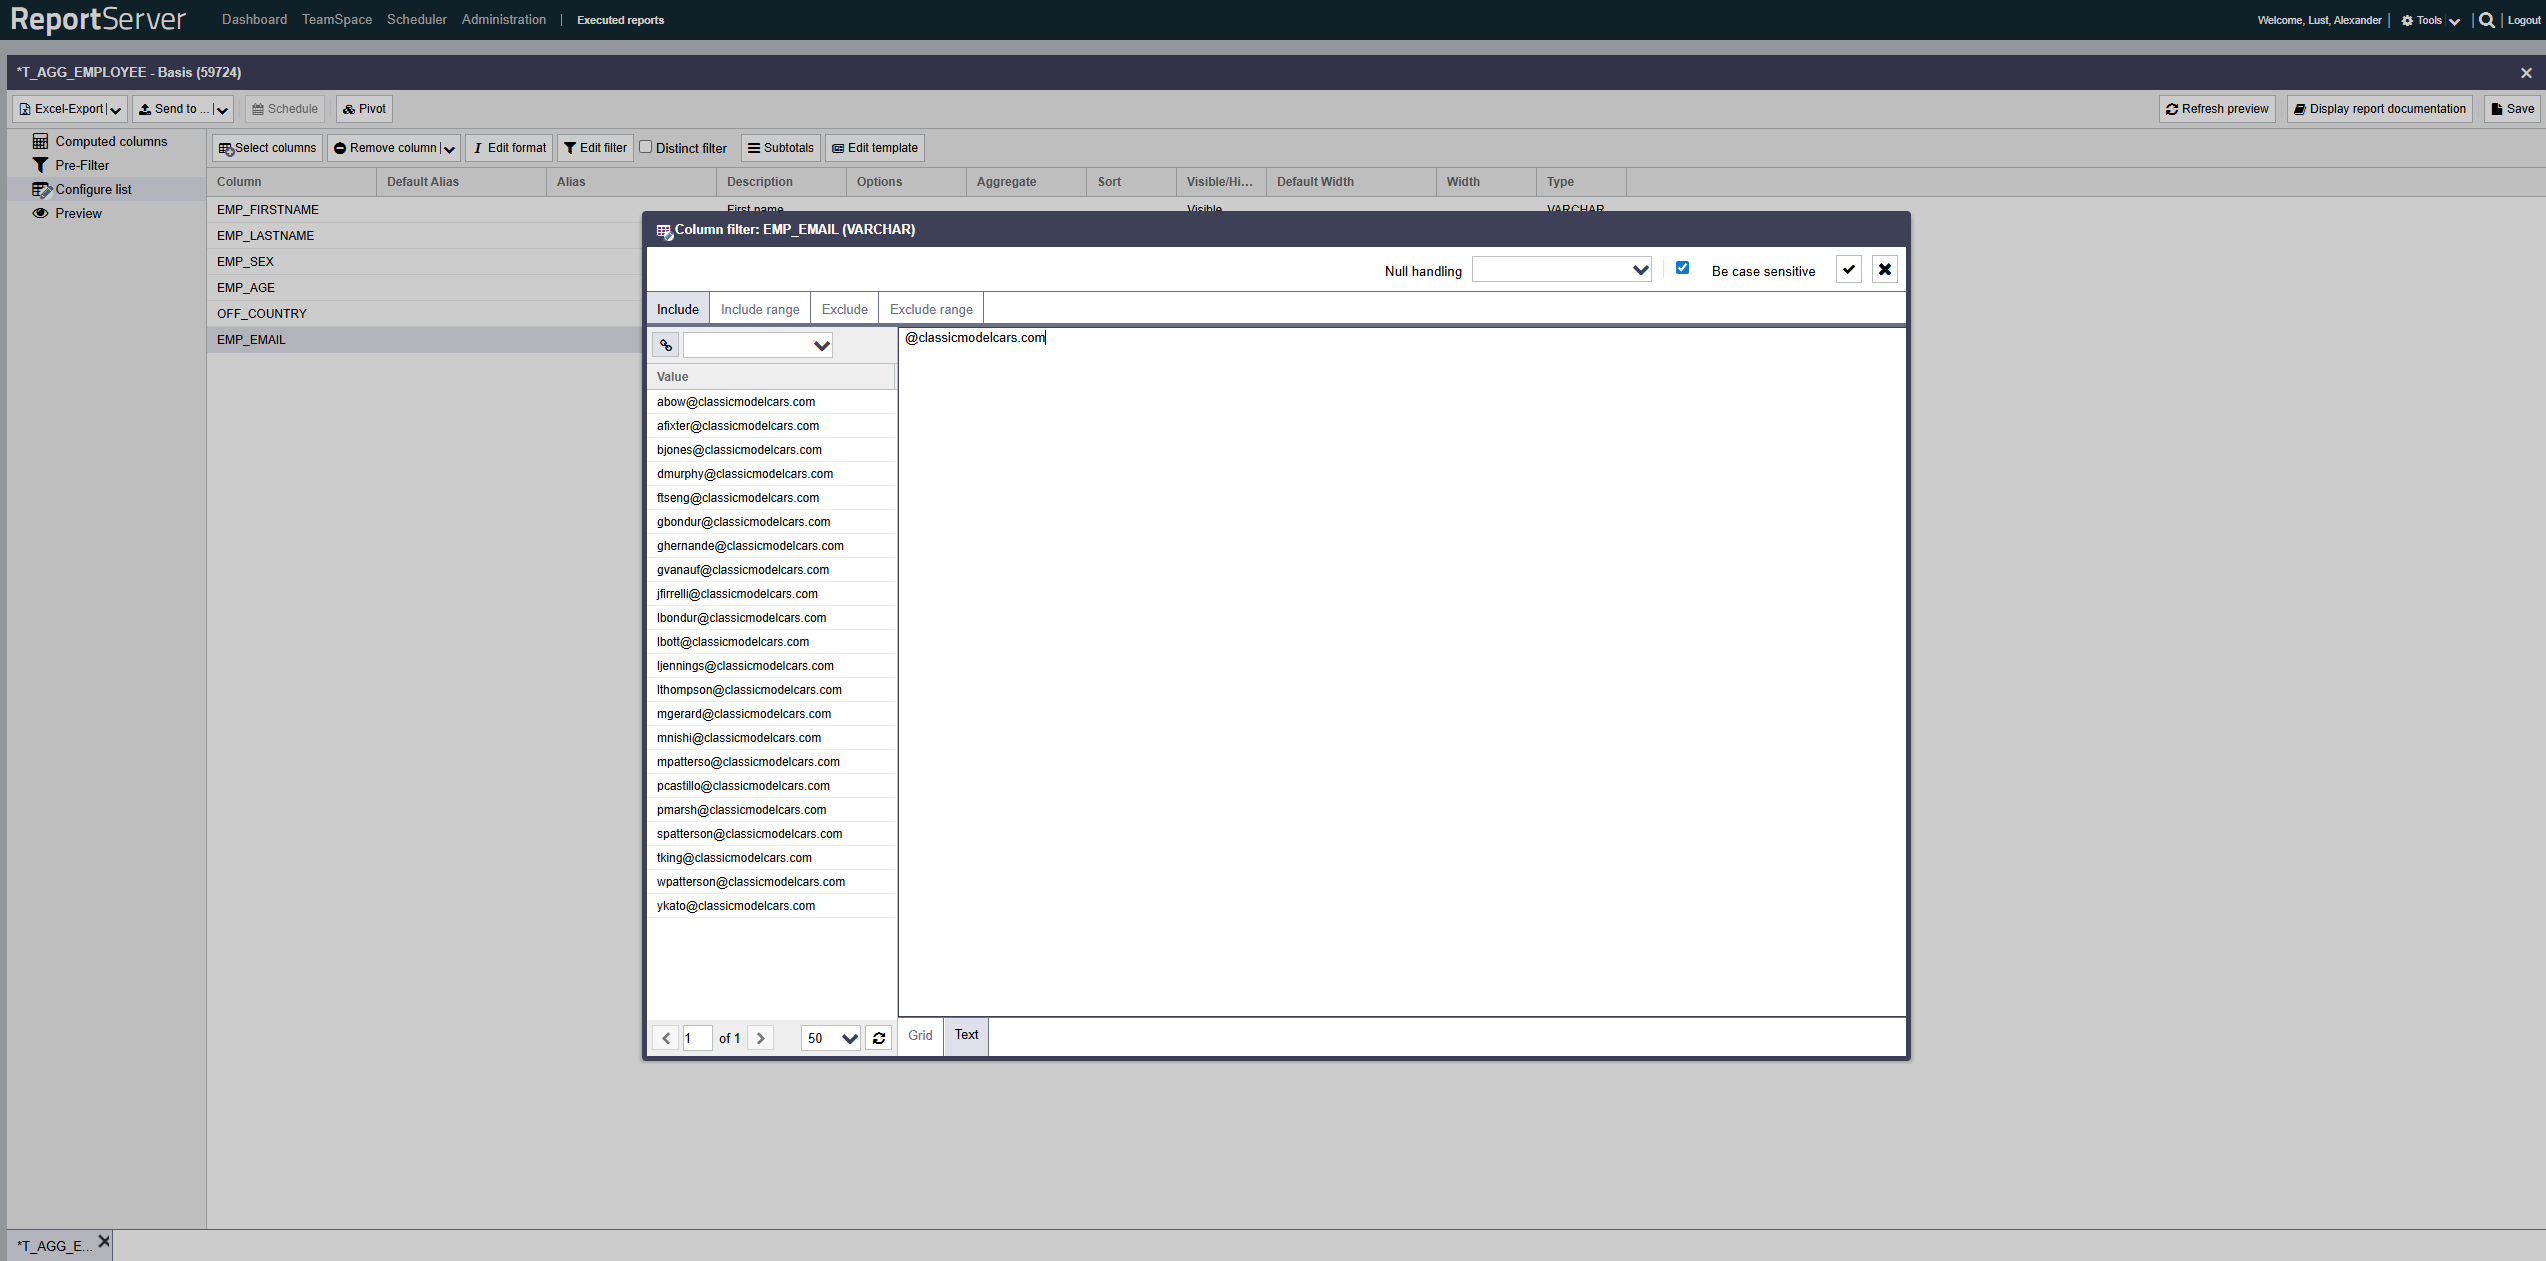
Alternatively, instead of selecting values, you can switch the view from Grid to Text and enter values directly, or paste them from the clipboard (copy & paste).
In text mode, ranges are entered as "A - B". Note the spaces before and after the hyphen. By omitting one of the range bounds you can define an open interval. The range definition "all values greater than 5" would be written as "5 - ".
To load all values occurring in the column regardless of already configured restrictions, click the (enforce consistency) next to the search field. (You will usually not need this functionality.) It allows you to define filters that would produce an empty result with the current data basis, but may still be meaningful if the underlying data changes.
By default, filtering is case-sensitive, i.e. the value in the data must be written exactly as your filter expression. If desired, you can disable this via the option. Note that ignoring case can negatively impact performance of the resulting query.
A special characteristic of databases you should be aware of when filtering is the handling of empty cells. By an empty cell we mean a cell in which no value is present (in database jargon: the value is NULL). NULL is in particular different from an empty string "" or the number 0.
Due to the property that NULL is different from every value, all cells with the value NULL are excluded as soon as you define any filter. Especially if only an exclusion filter is defined, this may seem counterintuitive, but it is common in relational algebra---the basis of all common database systems---and is therefore implemented in ReportServer accordingly.
This means: if you have defined filters on a column and empty cells should also be included in the result set, you must explicitly include the empty cells. Conversely, explicitly excluding empty cells is only necessary if you otherwise have not defined any filters on this column. You control the handling of empty cells via the corresponding .
Please note that due to the definition of floating-point numbers, equality checks are only possible to a limited extent. When filtering columns of type Float or Double, you should therefore preferably use range filters. Instead of including the value 5.1, use for example a range filter 5.0009 - 5.1001.
Using the option in the List configuration aspect, you can suppress the display of duplicate records in the result set. A row is considered duplicate if it is identical to another row in all visible columns.
ReportServer allows you to set the desired output format for each column directly in the list configuration. Select the desired column(s) and click the Column format button.
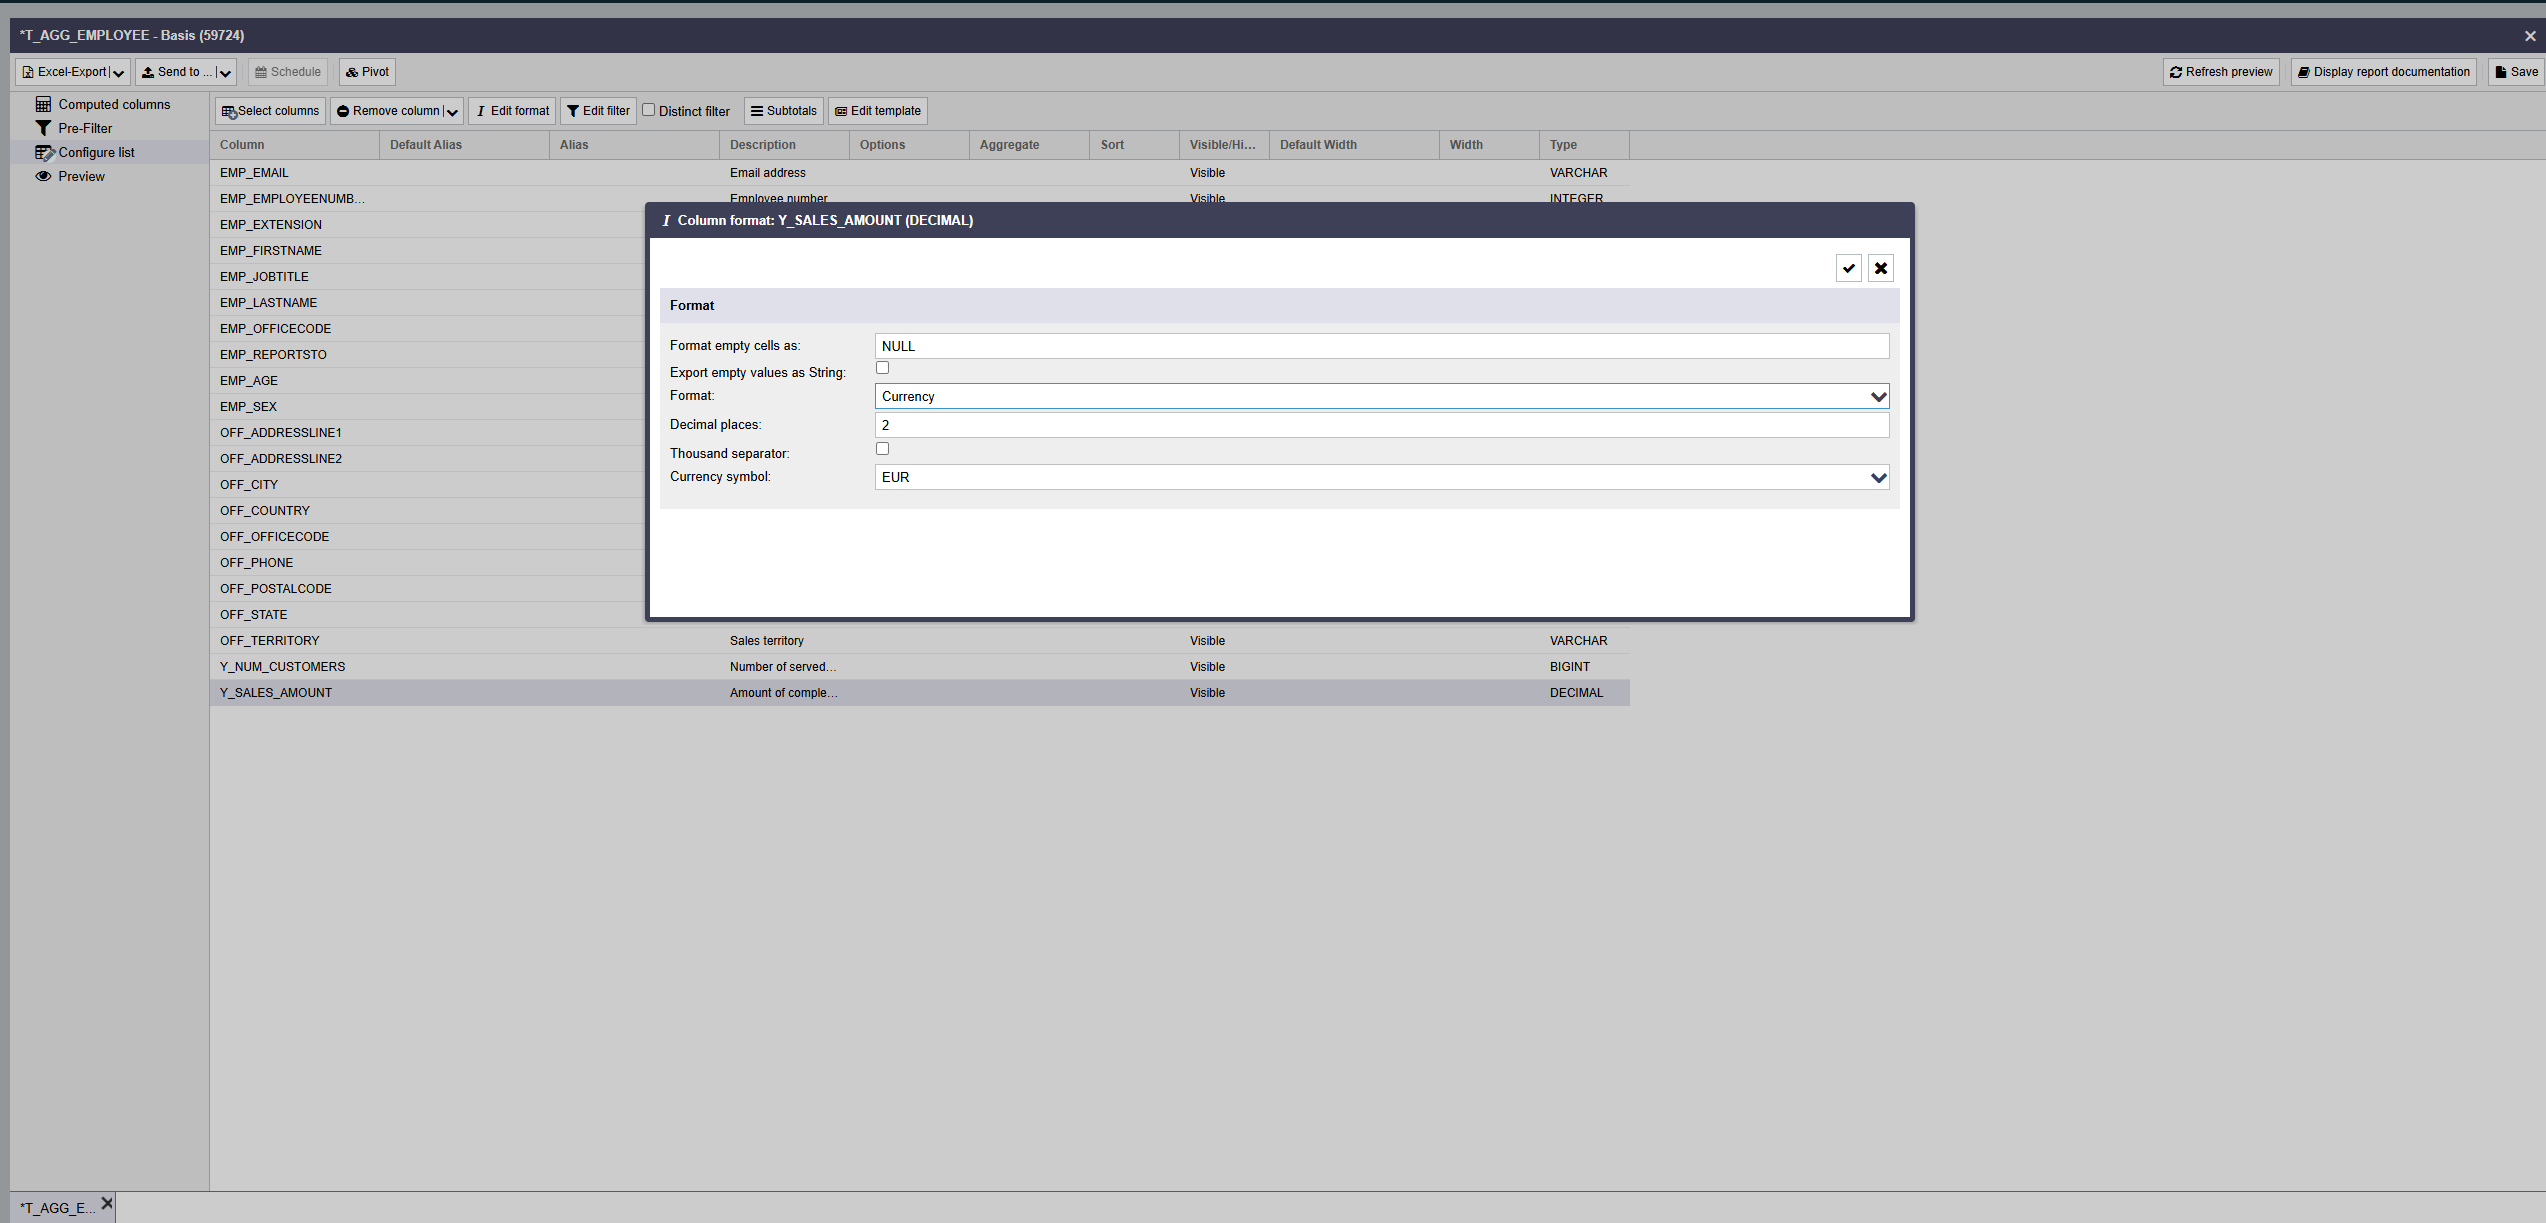
In the dialog that opens, you can specify the column format to be used.
Depending on the column's data type, the following formatting options are available:
| Number | The value is interpreted as a number and output with the configured number of decimal places. Optionally, a thousands separator can be configured. |
| Percent | The cell value is interpreted as a percentage. |
| Scientific | Numbers are output in exponential notation if applicable. |
| Currency | The value is interpreted as a number and extended by the selected currency symbol. |
| Date | The value is interpreted as a date and output in the specified target format. If the underlying column type is not a date type, the base format in which the values are stored in the database must additionally be specified. Using the options Clean invalid dates and Replace invalid dates, you can define how to handle database values that do not represent a valid date, e.g. 35.03.2012 or "Last Tuesday". Clean invalid dates would compute 04.04.2012 in the first case; in the second case, no correction is possible. Using Replace invalid dates, you can specify an alternative value. You can also provide a ${}-formula expression (see Chapter Formula Language) using the replacement "value" for the actual existing value. For the definition of target and base formats, refer to the Date format table in Appendix C. |
| Text | The value is interpreted as text---this preserves, for example, leading zeros. |
| Template | Allows specifying a ${}-formula expression that controls formatting (see Chapter Formula Language). The replacement "value" contains the existing value. |
Using the button, you open the report documentation. It summarizes all settings made in a clear form. Note that the report documentation always refers to the last saved version of the variant. Figure shows an example report documentation. For further information, also see Section Report Documentation.

In the filter dialog, you can work with wildcards in text input mode in addition to specifying exact values.

The wildcard * stands for a character sequence of arbitrary length. This also includes the empty string. Example: "Roof*" matches "Roof space", "Roof truss", and "Roof" itself.
The wildcard ? represents exactly one arbitrary character.
Wildcards can also be used in the search field of the filter dialog.
For wildcards in range filters, the range is chosen as wide as possible. If the pattern defined by the wildcard matches multiple values, the smallest matching value is selected for the lower bound and the largest matching value for the upper bound.
Note that if there is no value matching the pattern for one of the bounds, the interval is empty. Especially for inclusion filters this can cause unexpected results; for example, "a* - z*" is empty if there is no value starting with "z".
Aggregation refers to combining or consolidating data records that are identical with respect to a grouping attribute and therefore form a group. For each group contained in the source data, the result set contains one record.
As an example, consider a list of people with the attributes gender and age. One possible aggregation would be the average age grouped by gender. In this case, a list with n records is consolidated into a result with one row per gender.
With aggregation, we therefore distinguish between attributes that determine which group a record belongs to (gender) and those that are consolidated into a single value using an aggregate function.
Aggregate functions implemented in ReportServer are:
| Average | Calculates the average value for an attribute. |
| Count | Returns the number of records per group. |
| Maximum | Returns the maximum value of the group. |
| Minimum | Returns the minimum value of the group. |
| Sum | Calculates the sum of all values in the group. |
| Variance | Calculates the variance. |
| Count distinct | Like Count, but considers only distinct values of the attribute. |
If an aggregate function is set for a column in ReportServer, all columns without aggregation are automatically treated as grouping attributes. It is not possible for a list to contain columns that are neither part of the aggregation nor part of the grouping.
To use aggregations in evaluations, set the aggregate function to be used for individual columns/attributes in the List configuration aspect.
To display the underlying individual records per group when using aggregation, use the function from the toolbar of the list configuration. In the dialog that opens, select from the non-aggregated columns those that should be used for grouping. All non-selected and non-aggregated attributes are shown in the individual records.
Filters in the List configuration aspect always apply to the visible final result. In combination with aggregation, this means that aggregation is performed first and the result is filtered afterwards. In our example with average age, a filter on the Age column filters the average age in the result, but it is not suitable for excluding individual records from the average calculation.
A filter on the "Age" column defined as "30 - " therefore does not change the average of the groups, but causes only groups with an average value greater than or equal to 30 to be displayed. If you are familiar with SQL, you can remember that filters on aggregated columns are implemented as HAVING filters.
To filter the records going into the aggregation (instead of filtering the aggregation result), you can use the Prefilter function described below.
Prefilters are a powerful tool for restricting the data basis of an evaluation. Their uses go far beyond the filters in the List configuration aspect. The three main differences are:
Filters with OR combinations While all filters in the column configuration are combined with AND (a record is included only if it satisfies the filter conditions of all columns), the prefilter allows any combination of AND and OR expressions to link filter conditions across different columns.
Column comparison Column comparison allows you to define a filter criterion based on the relation between two attributes of a record. For example, you can select all records where the value in column A differs from the value in column B.
Filtering before aggregation As described in the previous section, filters in the list configuration always apply to the visible result; with aggregation, filters therefore apply only after aggregation. Prefilters, on the other hand, always apply before aggregation. If no aggregation is configured, there is no difference between prefilters and list configuration filters in this regard.
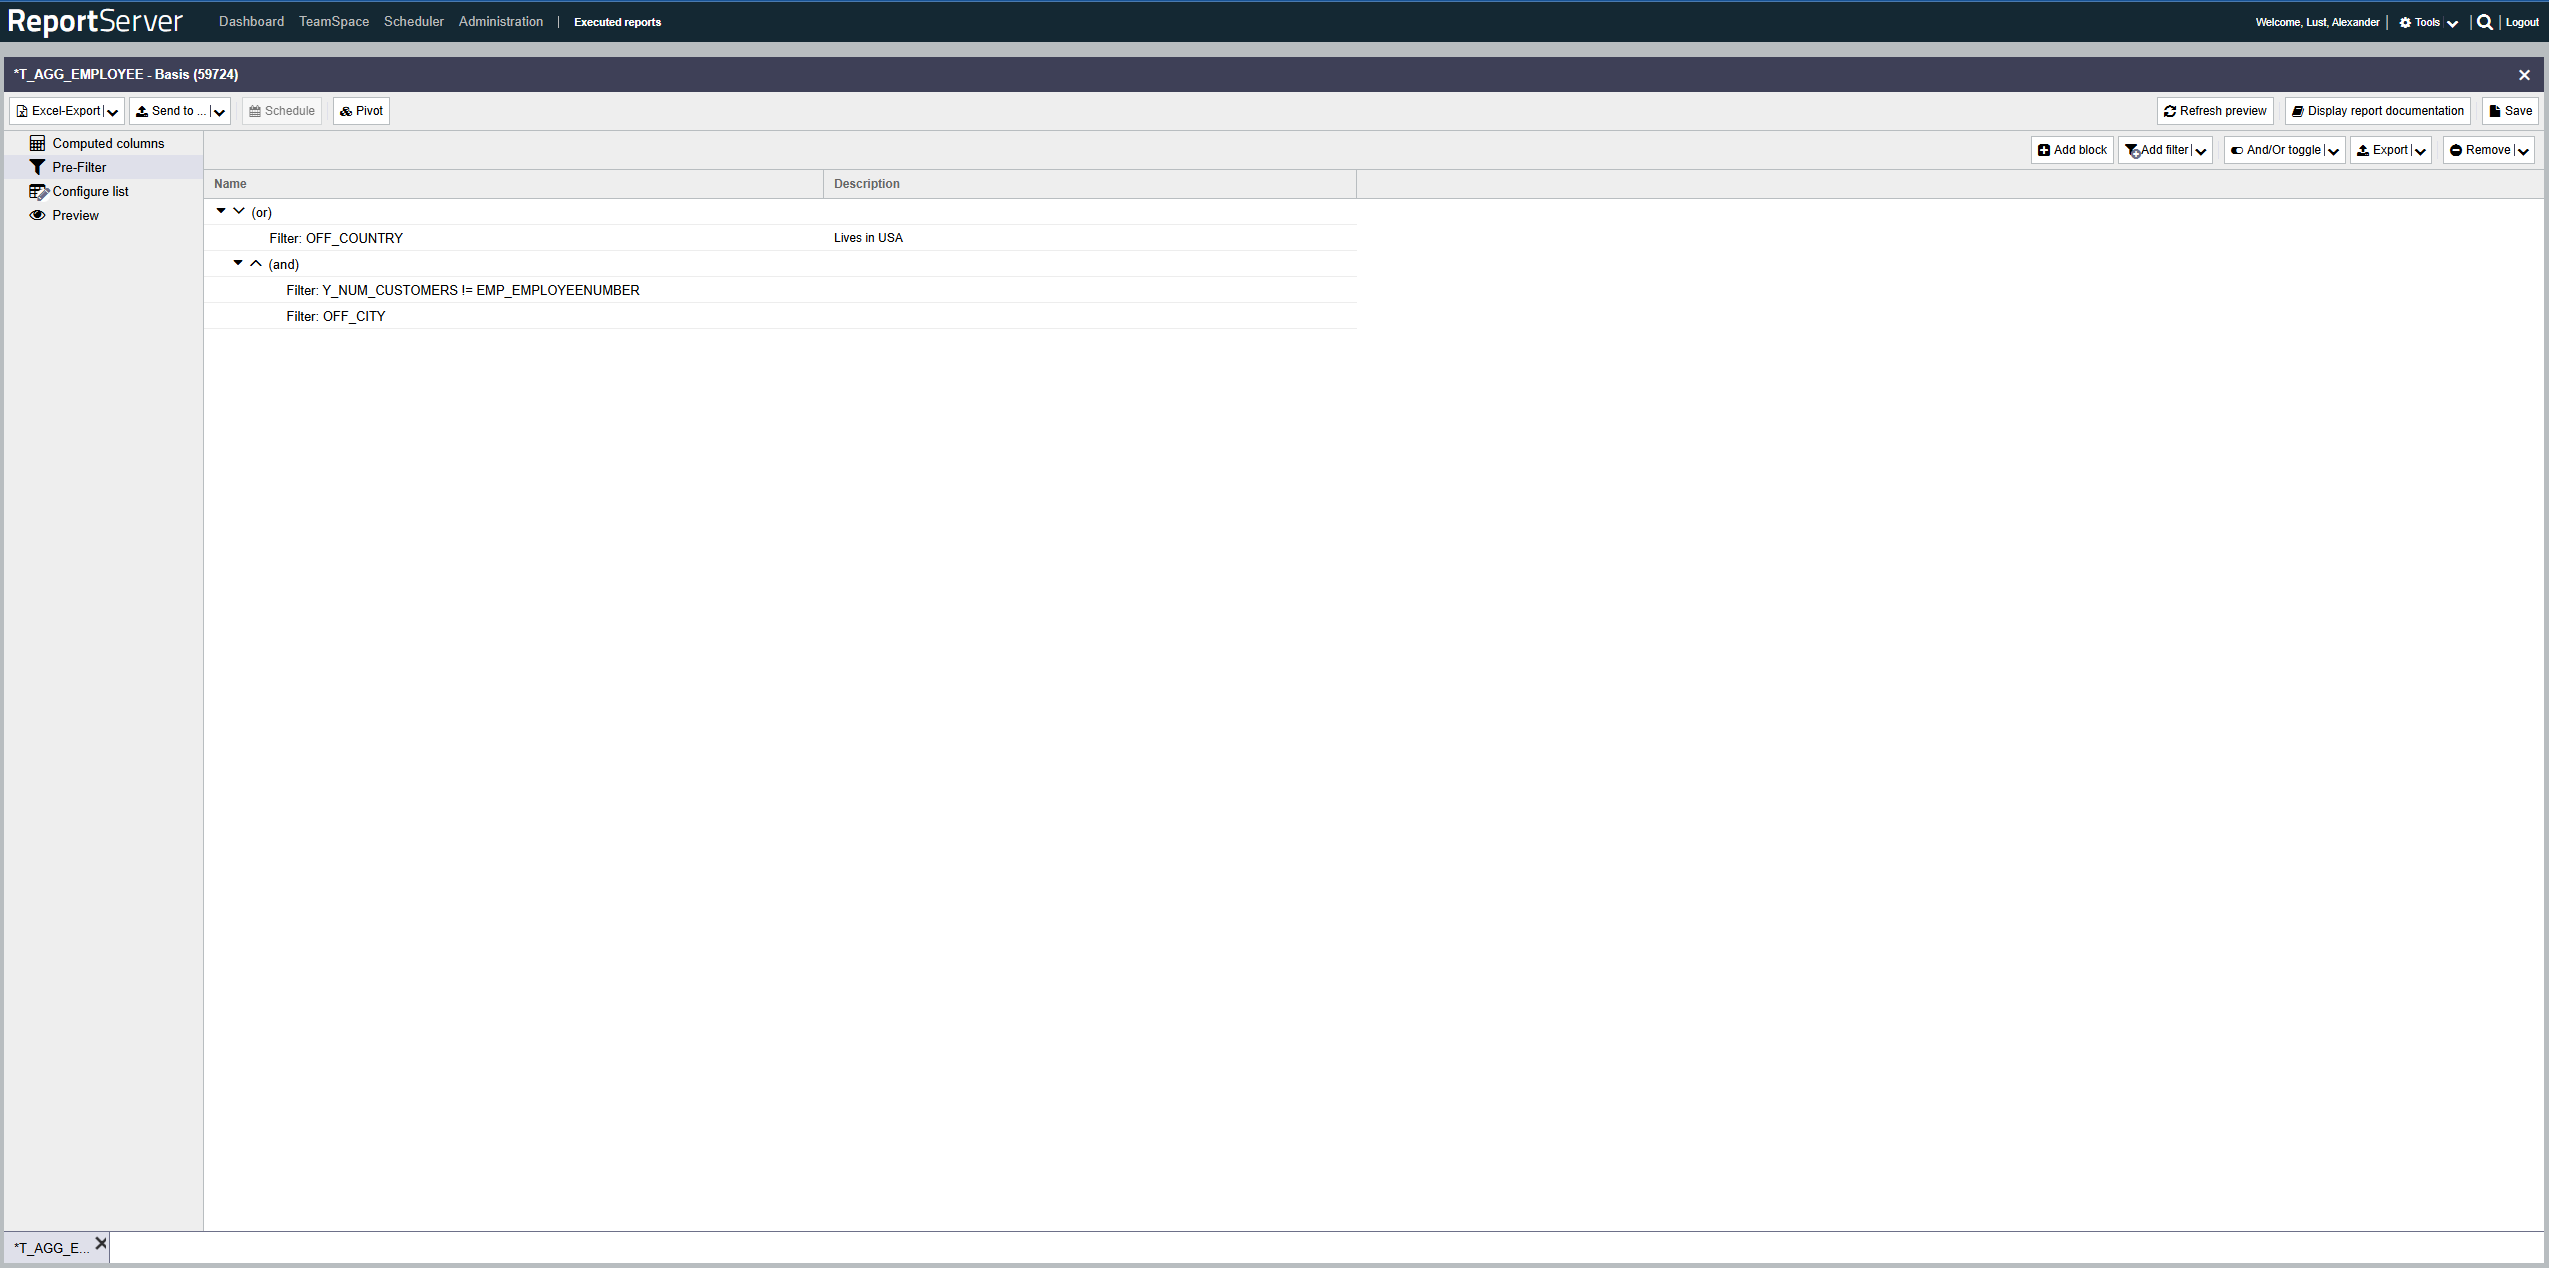
The prefilter contains a set of filter expressions that can be combined with AND and OR and can be nested arbitrarily.
Consider an example with the following five filters
A := Age > 30
B := Gender == female
C := Place of residence == Berlin
D := Age < 5
E := Place of birth == Place of residence
Combining these individual filters into the following expression
(B AND C AND (A OR D OR E))ReportServer displays such an expression as a tree, as follows:
| AND | B | |
| C | ||
| OR | A | |
| D | ||
| E | ||
AND and OR represent blocks that enclose the expressions below them. The AND block in the example therefore contains B, C, and the OR block. The OR block in turn contains A, D, and E.
When evaluating the tree, the individual filters (A, B, C, D, E) are first evaluated for each record. Each evaluation yields a boolean value: TRUE or FALSE.
Example record:
Age = 25
Gender = Female
Place of residence = Berlin
Place of birth = Stuttgart
Evaluating filters A to E against this record yields the following tree:
| AND | TRUE | |
| TRUE | ||
| OR | FALSE | |
| FALSE | ||
| FALSE | ||
In the next step, the truth values of blocks are determined by combining the truth values of the enclosed expressions using the block's logical operation.
An AND block is TRUE only if all enclosed expressions are TRUE. An OR block is TRUE if at least one enclosed expression is TRUE.
The block is then replaced by its truth value. This process is repeated until the root block is determined.
In the example, this happens in two steps:
| AND | TRUE |
| TRUE | |
| FALSE | |
| FALSE |
Thus, the example record is not part of the result set.
Using the toolbar you add blocks and filters to your expression. They are inserted below (as a part of) the currently selected block. Blocks and filters can be moved to another block via drag-and-drop. The order of expressions within a block is irrelevant. AND blocks can directly contain only OR blocks, and OR blocks can directly contain only AND blocks. When inserting new blocks or moving them, the correct type is chosen automatically.
The $-formula language mentioned several times can also be used in the filter dialog. Instead of a value, you can specify any formula in text mode. In filter formulas, in addition to the standard replacements (see Formula Language), the following additional objects/replacements are available for your own calculations:
| today | A calendar object that allows calculations based on the current date, e.g. a range filter that finds all invoices from the last 7 days. |
| agg | Provides access to calculations over all values of the current column, e.g. to identify outliers. |
| analytical | Provides access to analytical functions, e.g. to define a filter that includes the top 10%. |
The today object provides access to a full calendar. This calendar is initialized at runtime with the current date and time. Using the following functions, you can manipulate the date and/or time stored in the calendar.
| firstDay | Sets the calendar to midnight (00:00) of the first day of the current month. |
| lastDay | Sets the calendar to the last second of the last day of the current month. |
| addDays | Moves the calendar forward/backward by the specified number of days. |
| addMonths | Moves the calendar forward/backward by the specified number of months. |
| addYears | Moves the calendar forward/backward by the specified number of years. |
| setDay | Sets the calendar to the specified day. |
| setMonth | Sets the calendar to the specified month. |
| setYear | Sets the calendar to the specified year. |
| clearTime | Resets the time to midnight. |
| addHours | Moves the calendar forward/backward by the specified number of hours. |
| addMinutes | Moves the calendar forward/backward by the specified number of minutes. |
| addSeconds | Moves the calendar forward/backward by the specified number of seconds. |
| setHours | Sets the time to the specified hour. |
| setMinutes | Sets the time to the specified minutes. |
| setSeconds | Sets the time to the specified seconds. |
| format | Converts the date to a text in the specified format. This is required to compare values against columns that are not of type Date (see the Date format table in Appendix C.). |
Example: You want to filter all invoices from the previous month. You can define the following inclusion range filter:
${today.firstDay().addMonths(-1)} - ${today.firstDay().addSeconds(-1)}
If the column is of type VARCHAR (i.e., a text column) and the format is given as day.month.year, you must extend the expressions with a call to the format function:
	${today.firstDay().addMonths(-1).format("dd.MM.yyyy")}
	-
${today.firstDay().addSeconds(-1).format("dd.MM.yyyy")}The agg object provides access to calculations over all values of the current column. For example, you can define a filter expression that refers to the average value of the column.
The following functions are available:
| avg | Calculates the average. |
| count | Counts the existing values. |
| countDistinct | Counts the existing distinct values. |
| sum | Sums all values in the column. |
| variance | Calculates the variance of the column. |
| max | Determines the maximum value of the column. |
| min | Determines the minimum value of the column. |
Similar to the agg object, the analytical object allows you to define filters on a column based on calculations over all values of that column. In contrast to agg, which always returns a single value, analytical returns a set of values. Therefore, the analytical object can be used only in value filters, not in range filters.
The following functions are provided by the analytical object:
| top(n) | Returns the largest values of the column. |
| bottom(n) | Returns the smallest values of the column. |
| topGrouped(n,'Column name') | Returns the largest values of the column, grouped by the specified column. |
| bottomGrouped(n,'Column name') | Returns the smallest values of the column, grouped by the specified column. |
If n is given as an integer, it is interpreted as the number of values to return. A decimal number between 0 and 1 is interpreted as a percentage. For example, top(0.1) refers to the top 10%.
For the grouped functions, you must additionally specify a column name. The report is first grouped by this column and then the top or bottom values are determined.
Computed fields allow you to extend your evaluation with columns that do not exist in the source data but can be derived from existing columns by means of a calculation rule.

The calculation rule is specified as an SQL expression that is executed directly on the database. This in particular means that the available expressions depend on the database in use. Your administrator can tell you which functions are available in detail. This section explains only some general possibilities.
If you have defined a computed field in ReportServer, you can then use it like any other column in your evaluations. To display it in the result, you must add the computed field to the list configuration aspect of your evaluation.
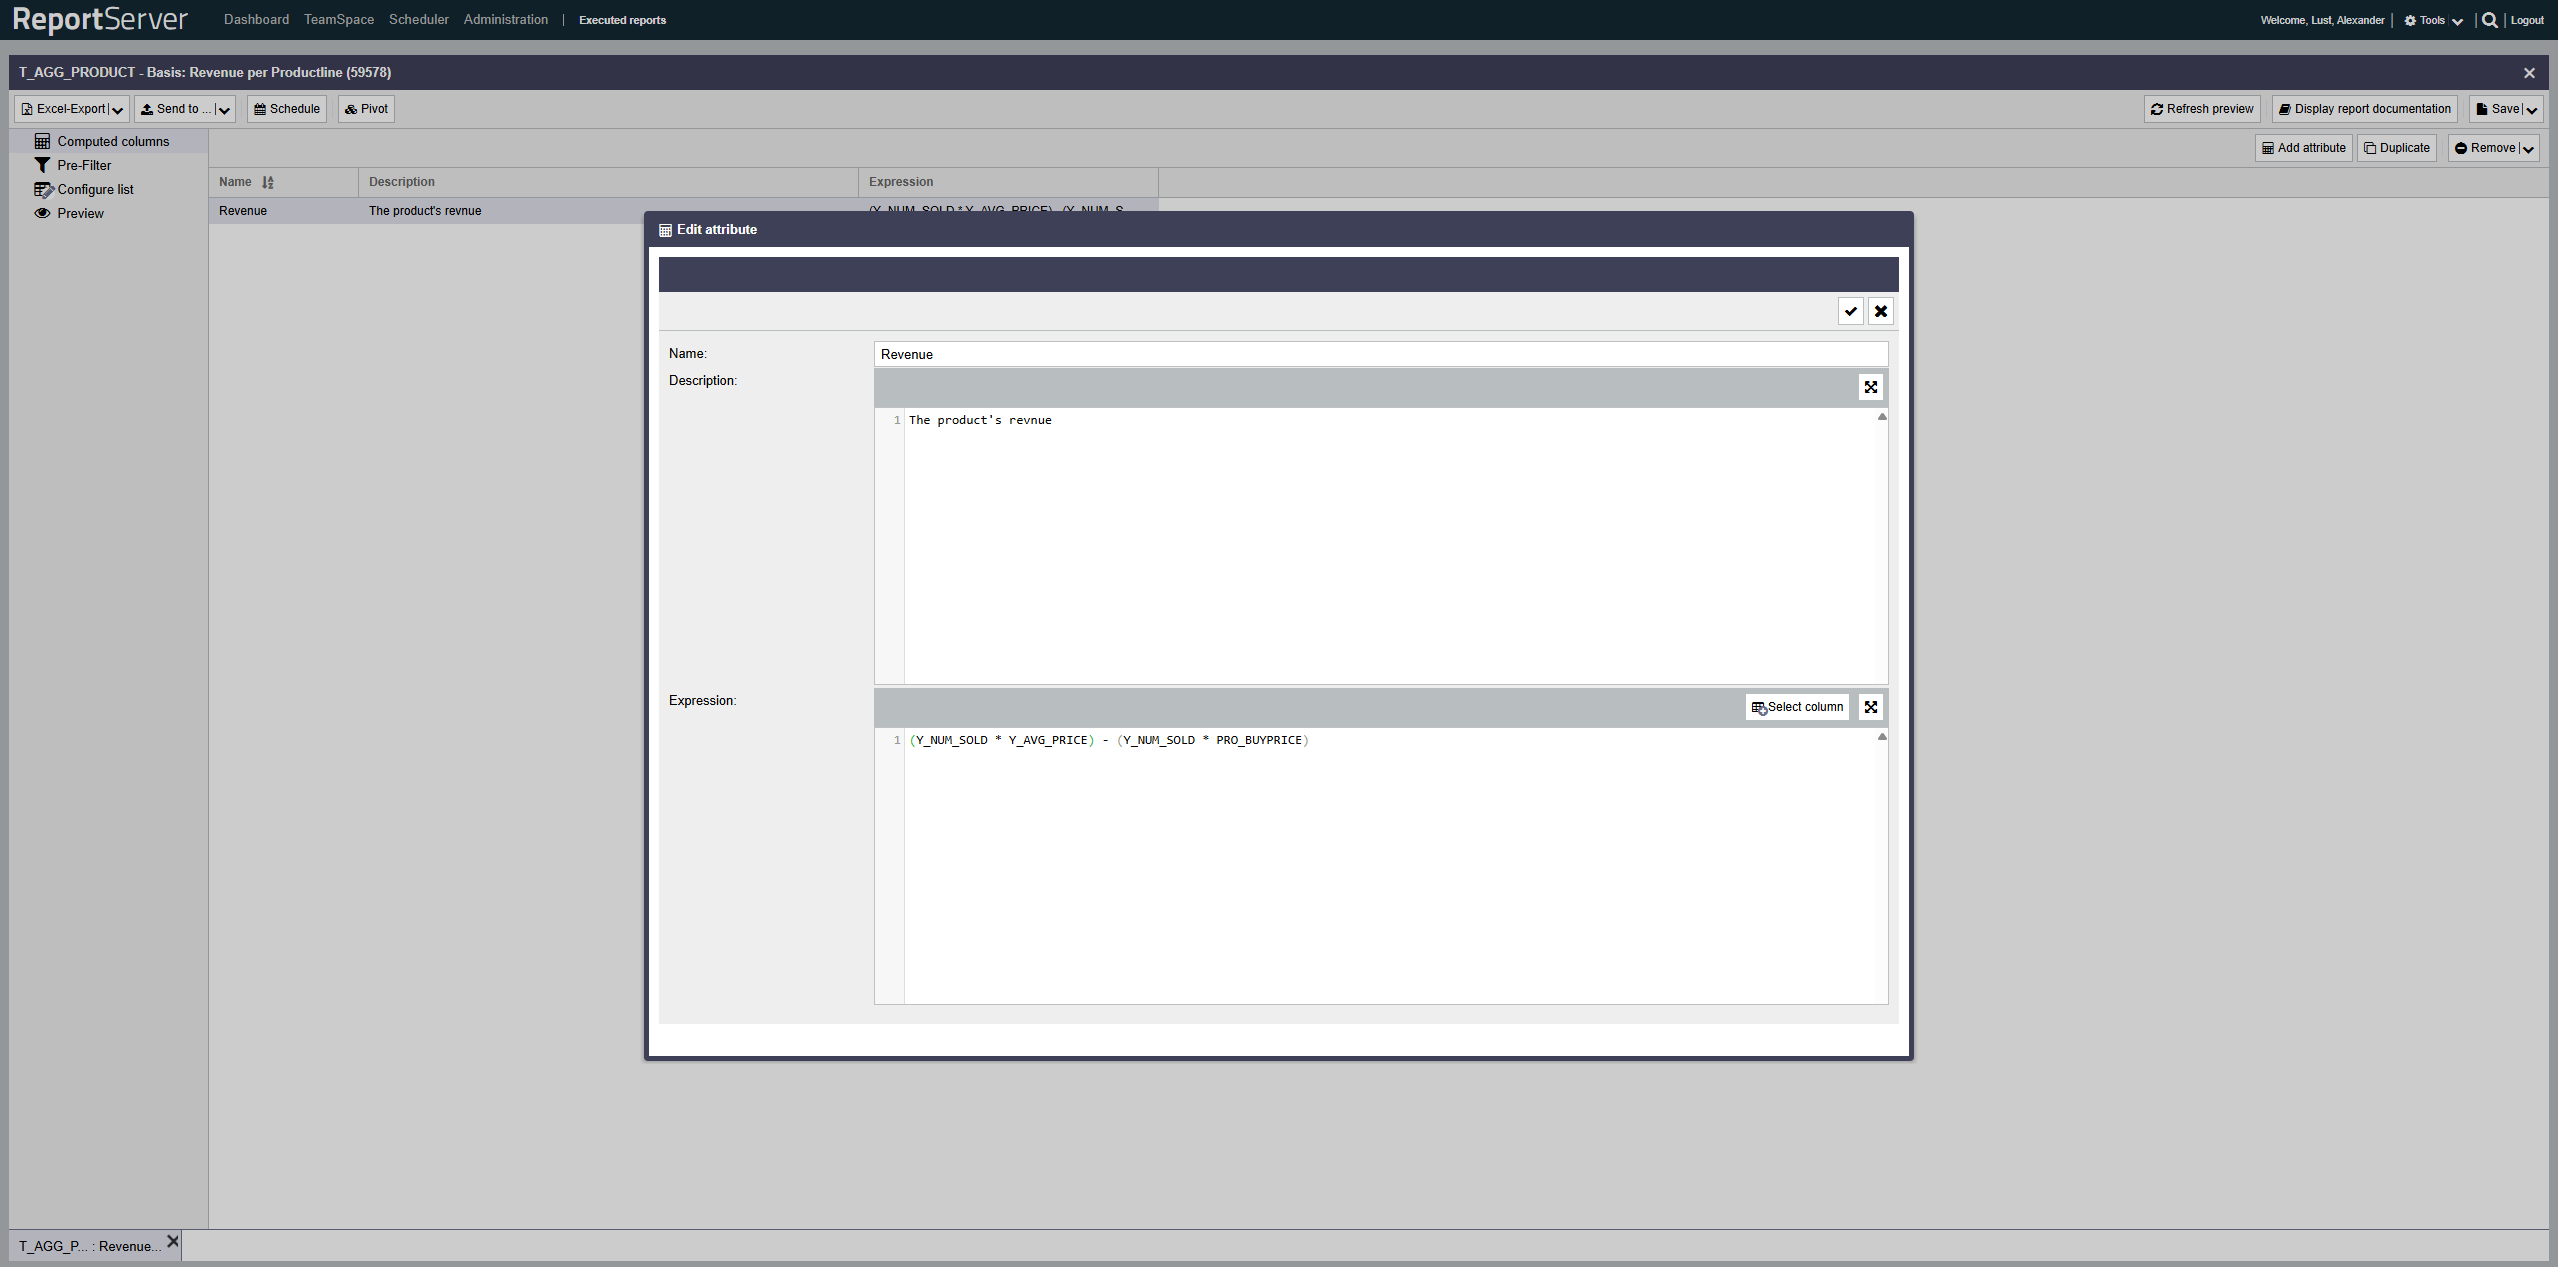
Computed fields are configured in the Computed Fields aspect. Here you can create fields and edit their definitions. The name you assign is used as the name of the created column and must therefore comply with the rules for column names (alphanumeric, no spaces). Column names must be unique.
SQL offers a wide range of possibilities to define a field, which clearly exceeds the scope of this guide. Nevertheless, here are a few code examples that are often used in computed fields.
In the following, we assume a table with the columns
A, B: text columns
C, D: integer columns
For simple calculations, you can use the basic arithmetic operators, e.g.
C + D as the definition for a field containing the sum of both columns.
Concatenation (joining two text columns) is usually done with the || operator. The + operator or a call to CONCAT(A, B) are also common, depending on the database.
With CASE expressions you can formulate conditions, for example to classify values depending on their value.
CASE
	WHEN COLUMN < 500 THEN 1
	WHEN COLUMN < 1000 THEN 2
	WHEN COLUMN < 2000 THEN 3
	WHEN COLUMN < 3000 THEN 4
	ELSE 0
END
For CASE expressions, note that the first matching condition is chosen, regardless of whether a later condition might also match. The return values of all branches must have the same data type.
In addition to the familiar export formats such as Excel or CSV, Dynamic Lists can also be inserted directly into predefined templates. In this section, we introduce the basic functionality.

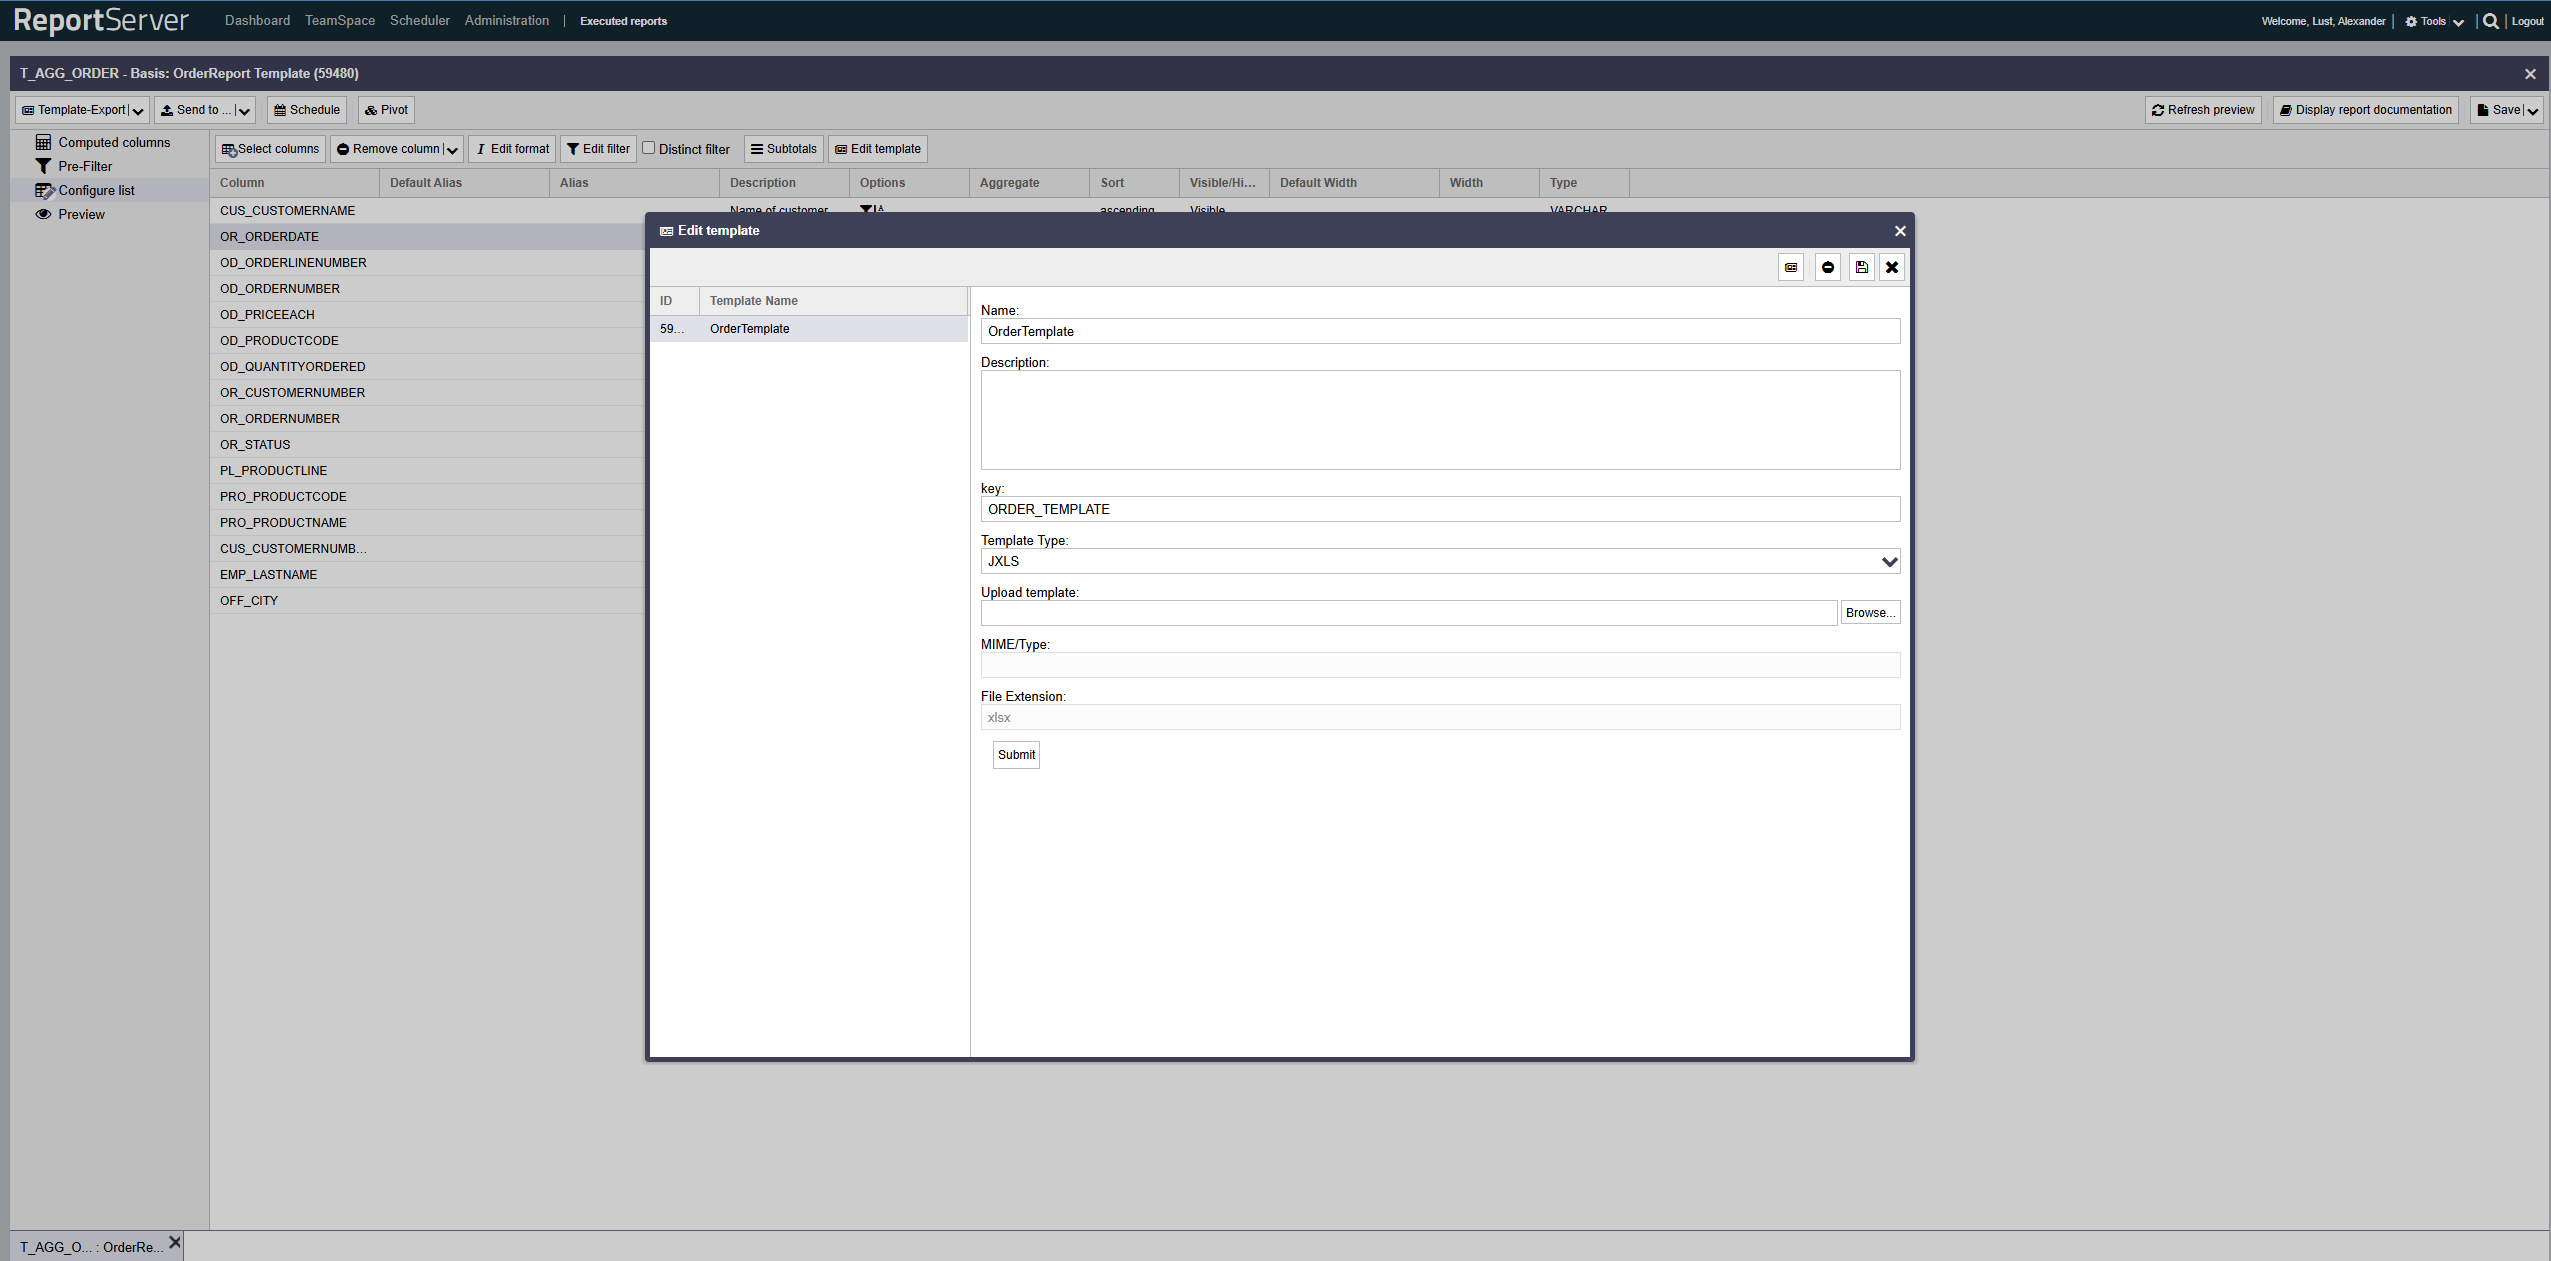
Templates are managed when executing a Dynamic List via the button in the aspect. In the dialog that opens, you will see a list of the templates currently available for this variant. Using the toolbar, you can add new templates or download existing ones for editing.
In addition to a name and description, templates also have a type. Currently, the following types are available:
| jXLS | Allows defining templates in Microsoft Excel. |
| XDoc | Allows defining templates in Microsoft Word. |
| Velocity | Allows defining text templates. |
| XSLT | Allows defining XML templates. |
After creating a new template, you can upload the corresponding file. In the following, we provide an example for each template type. A complete documentation of the functionality would go beyond the scope of this manual. Further documentation on the individual template formats can be found at:
| JXLS | https://jxls.sourceforge.net |
| XDocReport | https://github.com/opensagres/xdocreport |
| Velocity | https://velocity.apache.org/ |
| XSLT | https://www.w3.org/TR/xslt |
By integrating the JXLS template engine into ReportServer, it is possible to generate even sophisticatedly formatted Excel worksheets directly from the reporting platform. The JXLS approach is that the template---which determines the appearance of the final document---is itself an Excel workbook and can therefore be created and edited directly with Microsoft Excel. Special instructions in the template document control where data is inserted into the template.
Examples of JXLS in ReportServer can be found here: https://github.com/infofabrik/reportserver-samples/tree/main/src/net/datenwerke/rs/samples/templates/jxls.
A detailed description of all JXLS features would go beyond the scope of this document; therefore, we only provide a short explanation of the basics. ReportServer supports JXLS2, which is briefly described below. The legacy JXLS1 version is not supported.
A complete JXLS2 documentation can be found on the JXLS project website at https://jxls.sourceforge.net. Here we provide an overview of the most important components for working with ReportServer.
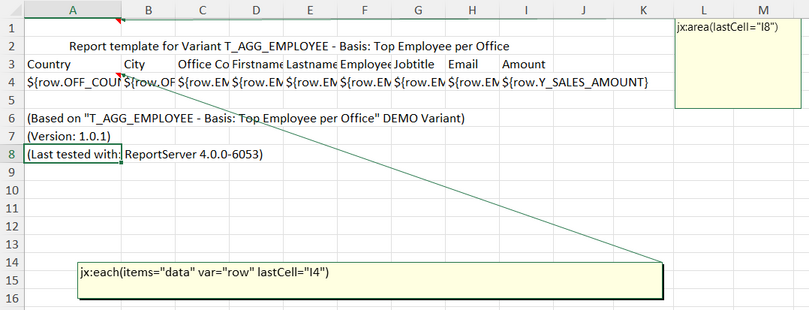
In JXLS2 (https://jxls.sourceforge.net), you define JXLS2 commands using Excel comments. The JXLS2 engine analyzes these comments and transforms the template accordingly. Below, we show a simple example template and briefly explain its components. Further information can be found in the Administration Guide (JXLS reports) and in the JXLS2 documentation.
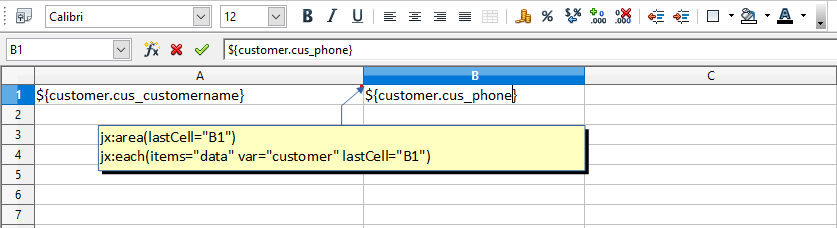
Cell A1 contains an Excel comment with the following text: jx: area (lastCell = "B1"). It defines the boundaries of our template as A1:B1. It also contains a JXLS Each command with the following text: jx: each (items = "data" var = "customer" lastCell = "B1"). The Each command iterates over the collection of objects in the "data" variable and prints the corresponding information. The main area of the Each command is A1:B1 (defined by the lastCell attribute). This means the cells are cloned and processed for each new customer object in the context.
Note that "data" contains the data selected by the Dynamic List. This is provided automatically by ReportServer and can be used directly in JXLS templates when the template is used for a Dynamic List.
	jx:area(lastCell="B1")
	jx:each(items="data" var="customer" lastCell="B1")

	${customer.cus_customername} | ${customer.cus_phone}
Please note that you must enter the field names in lower case so that they can be mapped correctly by the JXLS engine.
Now that we have learned how templates generally work as a basis in ReportServer, we will turn to an example.
To get a practical feel for using templates in ReportServer, we illustrate a concrete example of templates with JXLS below.
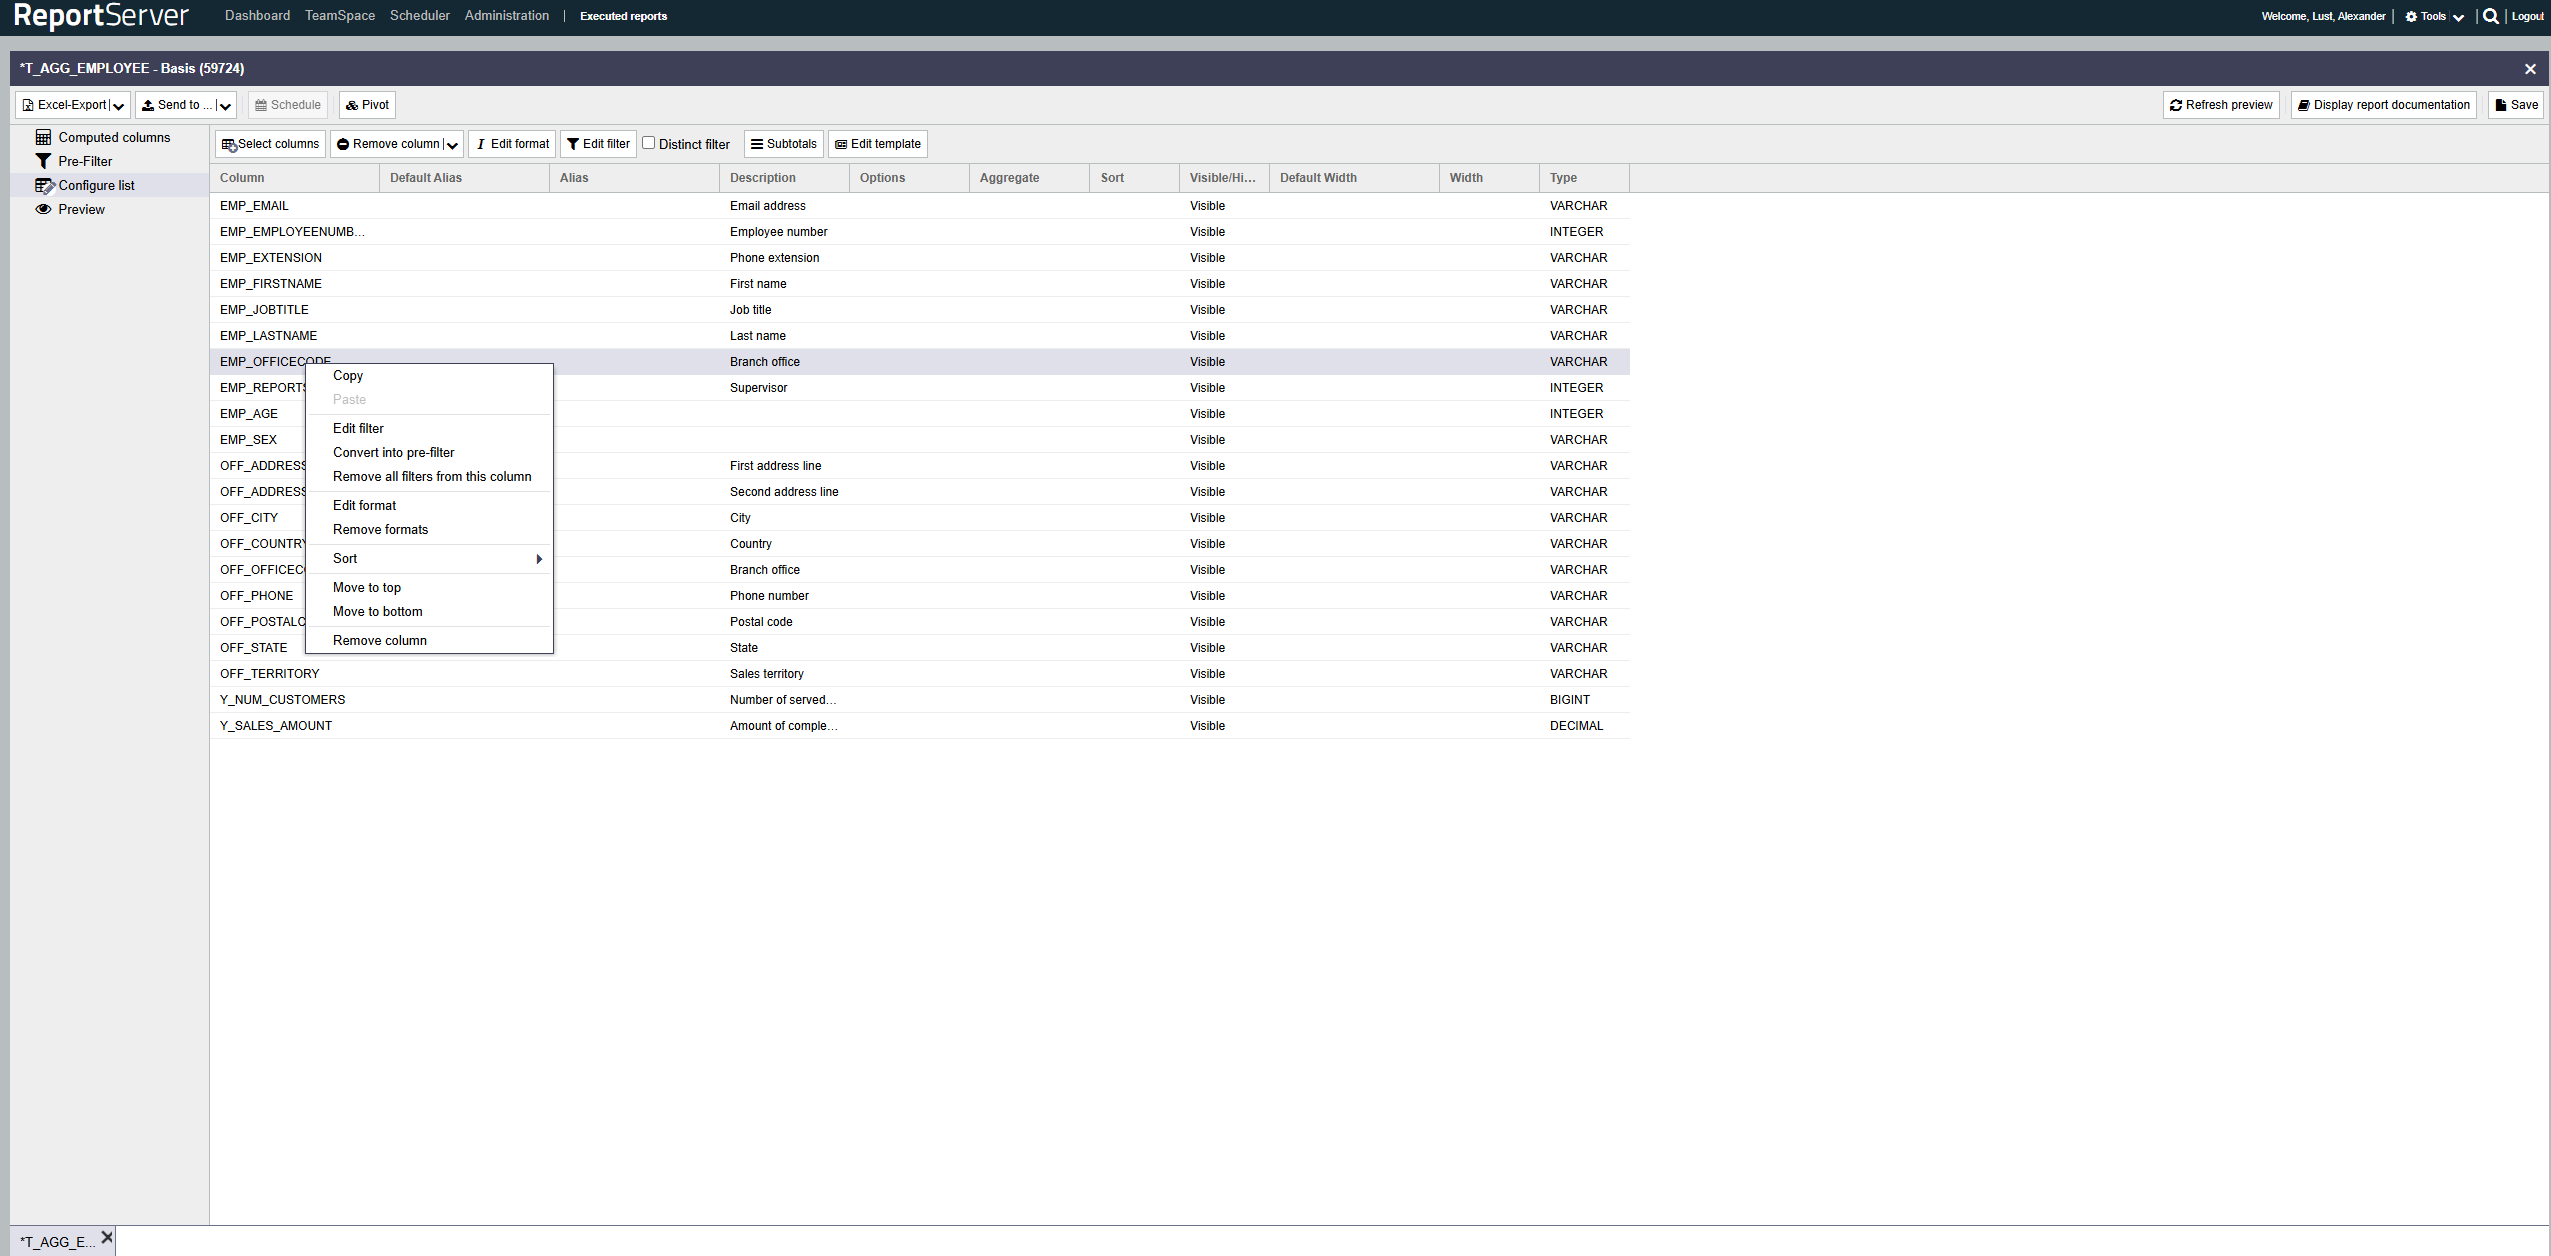
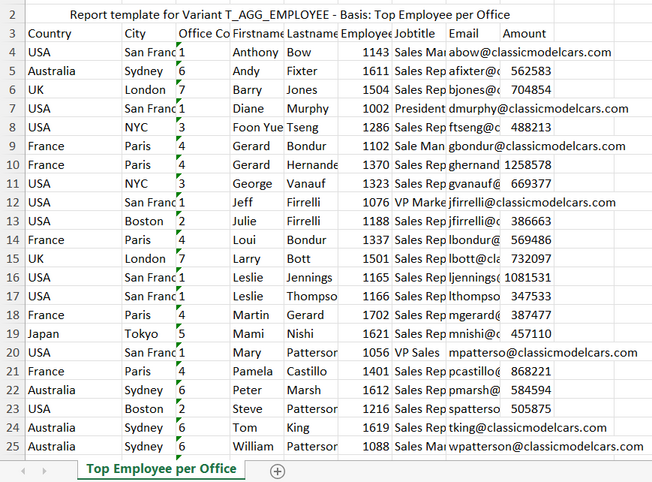
First, we create a Dynamic List and select the columns whose values we want to output via the template in a template-defined format. In this example, we use the sample report "T_AGG_EMPLOYEE" and select the columns "EMP_EMAIL", "EMP_EMPLOYEENUMBER", "EMP_FIRSTNAME", "EMP_JOBTITLE", "EMP_LASTNAME", "EMP_OFFICECODE", "OFF_CITY", "OFF_COUNTRY", and "Y_SALES_AMOUNT".
Next, we need to create the template. This is best done using Excel and can be based on an official example such as https://jxls.sourceforge.net/reference/each_command.html. For our example, you can download ready-made templates here: https://github.com/infofabrik/reportserver-samples/tree/main/src/net/datenwerke/rs/samples/templates/jxls/jxlsdynamiclist.
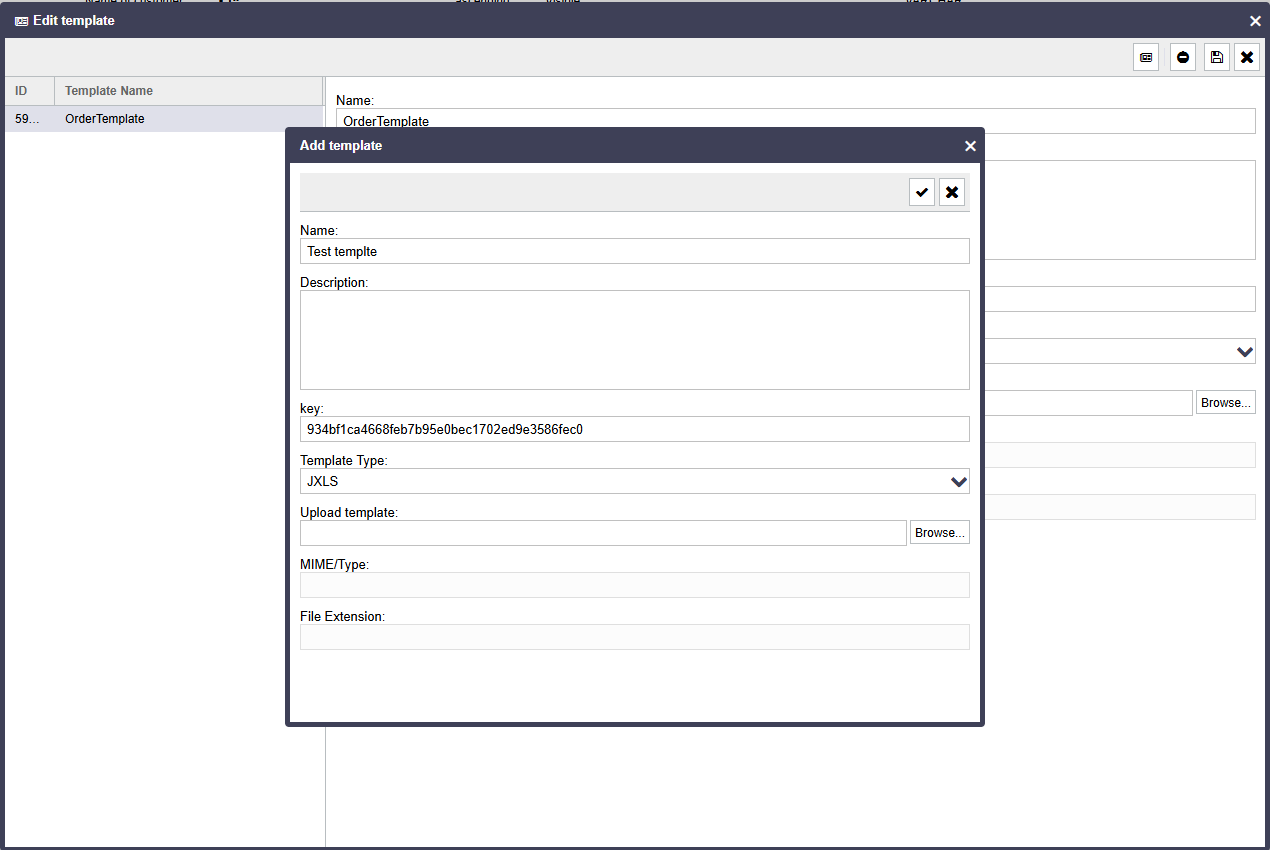
Now you only need to upload the template to ReportServer. Follow these instructions in exactly this order:
- Click Configure list
- Click Edit template
- Click Add template
- Select JXLS as the format in the Template Type drop-down menu
- Upload the Excel file created earlier

The Dynamic List should now offer a new export format called Template. With the example template above, the exported Excel file should produce the following output.

Velocity https://velocity.apache.org/ is a template language for text documents. It allows you to generate any output formats that use plain ASCII text as the file format.
You can find Velocity examples in ReportServer here: https://github.com/infofabrik/reportserver-samples/tree/main/src/net/datenwerke/rs/samples/templates/velocity.
Hello world, this is a Velocity template!Using the replacement $data, you can access individual records (the example assumes that the Dynamic List contains the field "CUS_CUSTOMER_NAME").
Customer list:
Customer List:
----------------------------------------------------------
#foreach ( $customer in $data )
	$customer.CUS_CUSTOMERNAME
#end
This template can also be downloaded from our reportserver-samples GitHub repository: https://github.com/infofabrik/reportserver-samples/tree/main/src/net/datenwerke/rs/samples/templates/velocity
You can use/display your report parameter values by using the available "parameters" object. For example, if your report has a parameter "myparameter", you can access it as follows:
$parameters.myparameterYou can also access all special parameters explained here: https://reportserver.net/en/guides/admin/chapters/using-parameters/ by using the available "meta" object. The following example prints the report name:
$meta._RS_REPORT_NAME.valueNote that, unlike the report parameters described above, "value" is required to retrieve the values of the special parameters.
XDocReport https://github.com/opensagres/xdocreport combines the Velocity template language with Microsoft Word.
You can find XDocReport examples in ReportServer here: https://github.com/infofabrik/reportserver-samples/tree/main/src/net/datenwerke/rs/samples/templates/xdoc.
To use template commands such as
#foreach ( $customer in $data )you must embed them into so-called . To do so, go to "Insert/Quick Parts/Field..." and select the MergeField field from the Mail merge category. In the input field under Field functions, enter the command. The Velocity example above could be represented as follows, where MERGEFIELD[XX] stands for a command as a merge field:
All customers:
MERGEFIELD[#foreach($customer in $data)]
MERGEFIELD[$customer.CUS_CUSTOMERNAME]
MERGEFIELD[#end]
The following screenshot shows the resulting template in Word. This template and the results of executing it can also be downloaded from our reportserver-samples GitHub repository: https://github.com/infofabrik/reportserver-samples/tree/main/src/net/datenwerke/rs/samples/templates/xdoc

You can use/display your report parameter values by using the available "parameters" object. For example, if your report has a parameter "myparameter", you can access it as follows:
MERGEFIELD[$parameters.myparameter]You can also access all special parameters explained here: https://reportserver.net/en/guides/admin/chapters/using-parameters/ by using the available "meta" object. The following example prints the report name:
MERGEFIELD[$meta._RS_REPORT_NAME.value]Note that, unlike the report parameters described above, "value" is required to retrieve the values of the special parameters.
To create XML based on Dynamic Lists, you can use XSLT (Extensible Stylesheet Language Transformations).
The input data for the XSL transformation is the HTML export from ReportServer. Below we present a simple generic transformation that converts the data into a simple XML format by first listing all attributes and then inserting a "record" element for each record:
You can find this example here: https://github.com/infofabrik/reportserver-samples/blob/main/src/net/datenwerke/rs/samples/templates/xslt/.
<?xml version="1.0"?>
<xsl:stylesheet version="1.0"
xmlns:xsl="http://www.w3.org/1999/XSL/Transform"
xmlns:xhtml="http://www.w3.org/1999/xhtml">

<xsl:template match="/">
    <myXmlFormat>
		<xsl:apply-templates select="//xhtml:tr"/>
	</myXmlFormat>
</xsl:template>

<!-- attributes -->
<xsl:template match="xhtml:thead/xhtml:tr">
	<attributes>
	<xsl:apply-templates mode="attributes" />
	</attributes>
</xsl:template>
<xsl:template match="xhtml:th" mode="attributes">
	<attribute>
		<xsl:value-of select="."/>
	</attribute>
</xsl:template>

<!-- values -->
<xsl:template match="xhtml:tbody/xhtml:tr">
    <records>
	<xsl:apply-templates mode="values" />
	</records>
</xsl:template>
<xsl:template match="xhtml:td" mode="values">
	<record>
		<xsl:value-of select="."/>
	</record>
</xsl:template>

</xsl:stylesheet>
The result could then look as follows, for example:
<?xml version="1.0" encoding="UTF-8"?>
<myXmlFormat
	xmlns:xhtml="http://www.w3.org/1999/xhtml">
	<attributes>
		<attribute>Country</attribute>
		<attribute>City</attribute>
		<attribute>Office Code</attribute>
		<attribute>Firstname</attribute>
		<attribute>Lastname</attribute>
		<attribute>Employee Nr</attribute>
		<attribute>Jobtitle</attribute>
		<attribute>Email</attribute>
		<attribute>Amount</attribute>
	</attributes>
	<records>
		<record>USA</record>
		<record>San Francisco</record>
		<record>1</record>
		<record>Leslie</record>
		<record>Jennings</record>
		<record>1165</record>
		<record>Sales Rep</record>
		<record>ljennings@classicmodelcars.com</record>
		<record>1.081.530,54</record>
	</records>
	<records>
		<record>USA</record>
		<record>NYC</record>
		<record>3</record>
		<record>George</record>
		<record>Vanauf</record>
		<record>1323</record>
		<record>Sales Rep</record>
		<record>gvanauf@classicmodelcars.com</record>
		<record>669.377,05</record>
	</records>
</myXmlFormat>